The Austin residential real estate market continues to evolve amid shifting economic conditions and buyer sentiments. Using data sourced from Austin ABOR MLS, we’ve analyzed key indicators from April 2025 and compared them year-over-year with April 2024 and April 2023. Below, we dive into the trends for median sale price, inventory, sales volume, closed sales, and new listings to provide a clear picture of where the market stands and where it may be heading.

1. Year-Over-Year Comparison for April
| Year | Median Sale Price | Closed Sales | Sales Volume (B) | Months of Inventory | New Listings | Active Listings |
|---|---|---|---|---|---|---|
| 2025 | $450,000 | 2,484 | $1.48B | 5.6 | 5,710 | 13,351 |
| 2024 | $469,998 | 2,708 | $1.64B | 4.3 | 5,131 | 10,808 |
| 2023 | $466,705 | 2,611 | $1.54B | 3.2 | 4,115 | 8,285 |
2. Median Sale Price Trend
While the median sale price peaked in mid-2022, it has been generally declining since then, reflecting buyer pushback in a high-interest-rate environment. From a high of $550,000 in April–May 2022, the price has decreased to $450,000 in April 2025.
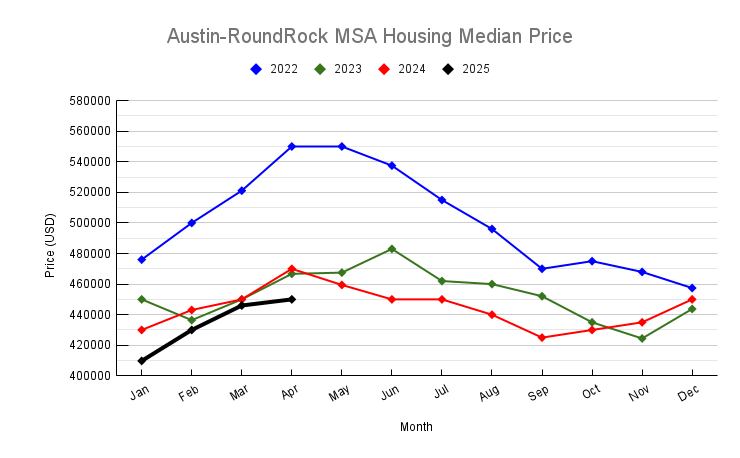
This downward trend indicates increasing buyer price sensitivity and suggests opportunities for more negotiation in the market.
3. Months of Inventory Trend
Inventory levels have climbed significantly—from just 0.8 months in April 2022 to 5.6 months in April 2025. A balanced market typically has 5–6 months of inventory, so Austin is now hovering near neutral territory after years of being a strong seller’s market.
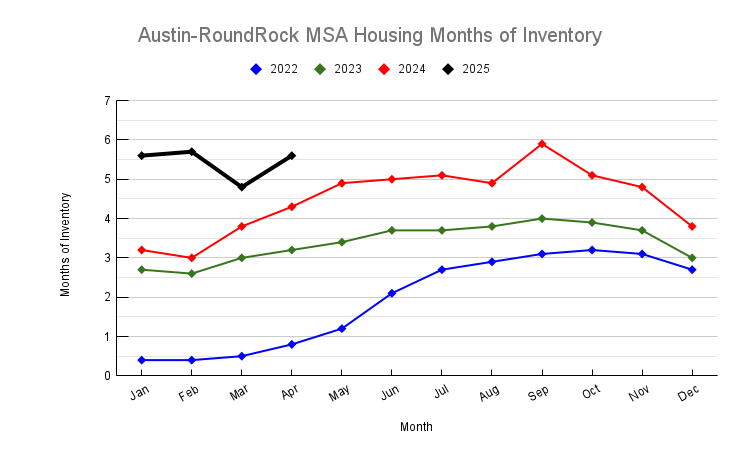
This suggests:
- Reduced urgency for buyers.
- More options on the market.
- Slower transaction pace.
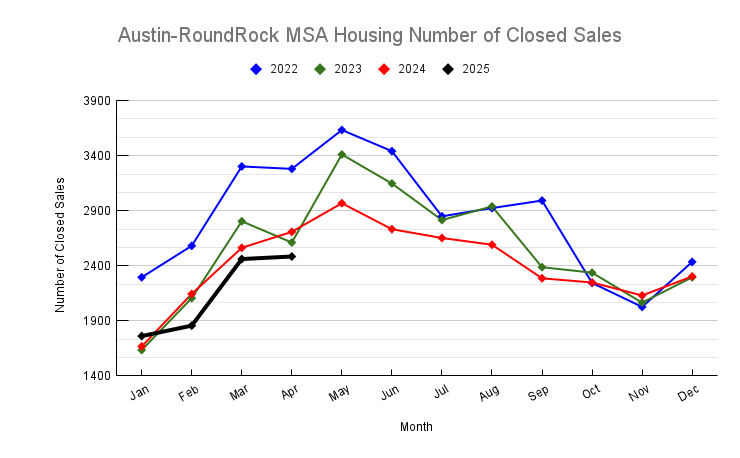
4. Closed Sales Trend
Closed sales followed a seasonal pattern but show an overall decline. April 2022 saw 3,280 sales, while April 2025 recorded just 2,484—a ~24% drop over three years. This aligns with reduced affordability, macroeconomic headwinds, and increased mortgage rates slowing buyer activity.
5. New Listings Trend
Sellers are re-entering the market in growing numbers. April 2025 saw 5,710 new listings—a 38% increase compared to April 2023. This surge may reflect pent-up supply, expired COVID-era low mortgage rates, or a desire to capitalize on current home values before any further declines.
Conclusion
Austin’s housing market in April 2025 reflects a shift toward normalization. Prices are softening, inventory is increasing, and sales activity is cooling. While this may create uncertainty for sellers, it opens doors for buyers who previously found themselves priced out. The market is no longer a frenzy but a more measured, competitive environment where negotiation, patience, and timing matter more than ever.
Whether you’re a buyer, seller, or investor, staying informed on these metrics will help you make smarter decisions in a transitioning real estate landscape.