As of April 2025, the Travis County residential real estate market, according to Austin ABOR MLS data, continues to evolve against the backdrop of rising inventory and stabilizing prices. Here’s a breakdown of recent trends and how they compare year-over-year and over the past three years.

1. Year-over-Year Comparison (April)
Let’s examine April over the past three years:
| Year | Median Sale Price | Closed Sales | Sales Dollar Volume (B) | Months of Inventory | New Listings | Active Listings |
|---|---|---|---|---|---|---|
| 2023 | $537,500 | 1,167 | $0.839B | 3.3 | 2,047 | 3,975 |
| 2024 | $540,185 | 1,260 | $0.943B | 4.8 | 2,585 | 5,507 |
| 2025 | $520,000 | 1,142 | $0.815B | 6.0 | 2,923 | 6,791 |
Insights:
- Price: The median sale price dropped slightly in 2025 (−3.8% from 2024), suggesting a mild softening of the market.
- Sales Activity: Closed sales were down from last year, and dollar volume followed suit, indicating a pullback in buyer demand.
- Inventory: A significant rise in months of inventory (up to 6.0) shows a transition toward a buyer’s market.
- Supply: New and active listings have grown, signaling more seller participation and longer time on the market.
2. Median Sale Price Trend
As shown in the chart above, the median sale price peaked in mid-2022 (~$659,000 in May) and has gradually adjusted downward. Despite minor rebounds (e.g., Spring 2024), the trend shows price moderation:
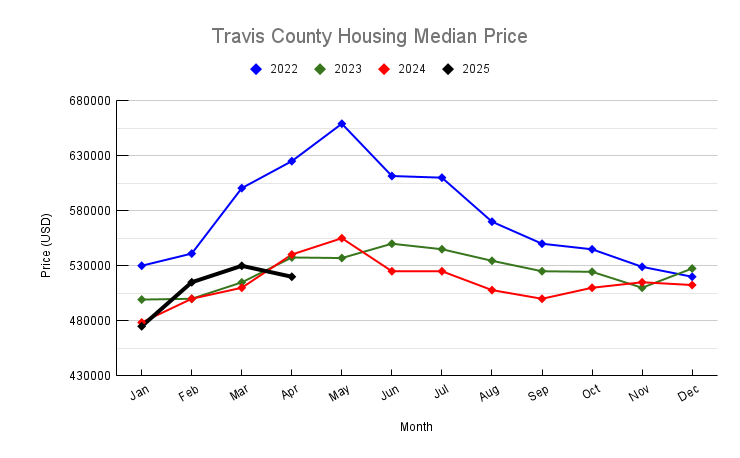
- 2022: Peak pricing due to low inventory and pandemic-era demand.
- 2023–2025: Corrections and stabilization, influenced by higher interest rates and increased inventory
3. Months of Inventory Trend
The months of inventory metric illustrates a clear and steady upward trend:
- Early 2022: Extremely tight market with <1 month of inventory.
- 2023: Gradual increase toward 4 months.
- 2024–2025: Climbed further to 6 months as of April 2025.
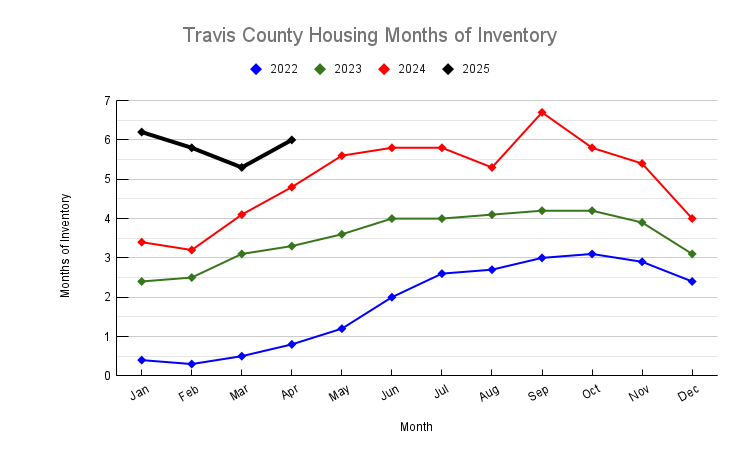
This rise suggests homes are staying on the market longer, giving buyers more choices and negotiating power. This shift toward a balanced or buyer-favoring market is a key development.
4. Closed Sales Trend
Closed sales have mirrored the overall market cooling:
- 2022: Strong sales activity, peaking with the spring market.
- 2023–2025: A downward shift in volume, reflecting caution among buyers.
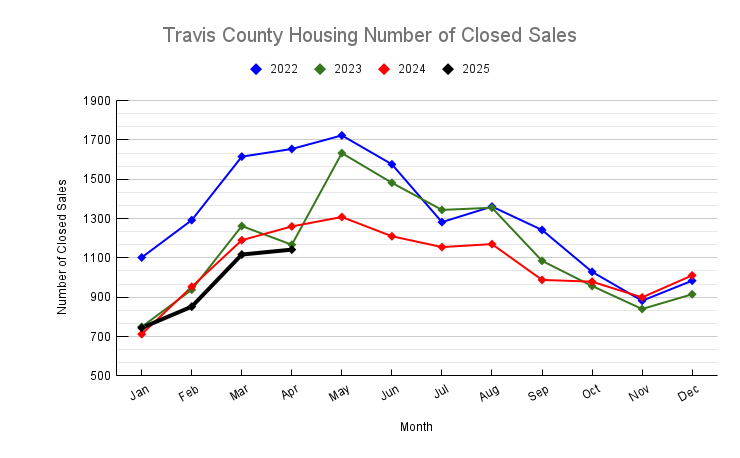
Sales activity in 2025 remains lower than in 2022 or 2023, reinforcing the narrative of a cooling demand environment.
5. New Listings Trend
The volume of new listings is growing:
- 2022–2023: Listing activity was relatively moderate.
- 2024–2025: Notable increase, peaking at 2,923 in April 2025.
This surge in listings shows that sellers are increasingly trying to exit, possibly due to timing the market before prices soften further. However, with slower absorption, many listings remain active longer.
Conclusion
The Travis County housing market in April 2025 is distinctly more favorable to buyers than it was in prior years. Inventory is at its highest point in years, prices are softening, and homes are taking longer to sell. While new listing activity remains strong, demand has not kept pace, creating a more competitive environment for sellers. For buyers, this may be a strategic window to negotiate better deals. For sellers, pricing competitively and offering concessions may be crucial in this evolving market.
If you have any questions or need any assistance in finding your new home or investment property, please contact me and I will be more than happy to work with you. You can read my client testimonials here.
Please also check out our rebate program which is a win-win situation for my buyer.