As the Williamson County housing market moves through mid-2025, trends in home prices, inventory levels, and sales activity are beginning to reflect broader economic shifts and buyer sentiment. Let’s break down how the market has changed — starting with a year-over-year comparison and diving into key performance metrics.

Year-over-Year Comparison: June 2025 vs. June 2024 and June 2023
| Metric | Jun 2023 | Jun 2024 | Jun 2025 | YoY (2025 vs. 2024) | YoY (2025 vs. 2023) |
|---|---|---|---|---|---|
| Median Sale Price | $449,945 | $434,000 | $425,000 | -2.1% ↓ | -5.5% ↓ |
| Closed Sales | 1,075 | 945 | 909 | -3.8% ↓ | -15.4% ↓ |
| Sales Dollar Volume | $0.550B | $0.472B | $0.445B | -5.7% ↓ | -19.1% ↓ |
| Months of Inventory | 3.0 | 4.1 | 4.8 | +0.7 ↑ | +1.8 ↑ |
| New Listings | 1,369 | 1,357 | 1,433 | +5.6% ↑ | +4.7% ↑ |
| Active Listings | 2,689 | 3,727 | 4,427 | +18.8% ↑ | +64.7% ↑ |
Key Takeaways:
- Home prices continue a modest but persistent decline.
- Closed sales and sales volume are dropping, suggesting weaker demand.
- Inventory levels are sharply rising, indicating a shift toward a buyer’s market.
Median Sale Price Trend
The median sale price in Williamson County peaked in Spring 2022 at $510,000 (April–June) and has steadily declined since. As of June 2025, the median sits at $425,000, reflecting a 16.7% drop from the peak.
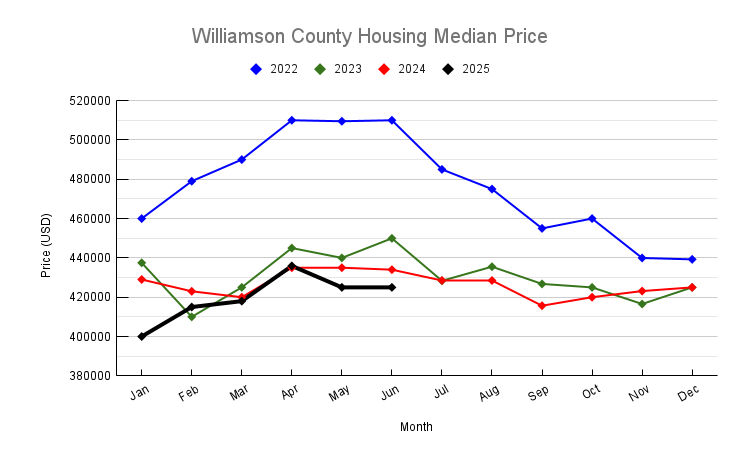
Trend Summary:
- 2022: Flat-to-slight downward movement post-peak.
- 2023: Continued downward correction.
- 2024–2025: Stabilization with modest fluctuations between $415K–$435K.
- 2025: Slight pressure remains as buyers gain negotiating power.
This pattern reflects a broader affordability recalibration and tighter financial conditions.
Months of Inventory Trend
Months of Inventory (MOI) is a key signal of market balance.
| Year | June MOI |
|---|---|
| 2022 | 2.0 |
| 2023 | 3.0 |
| 2024 | 4.1 |
| 2025 | 4.8 |
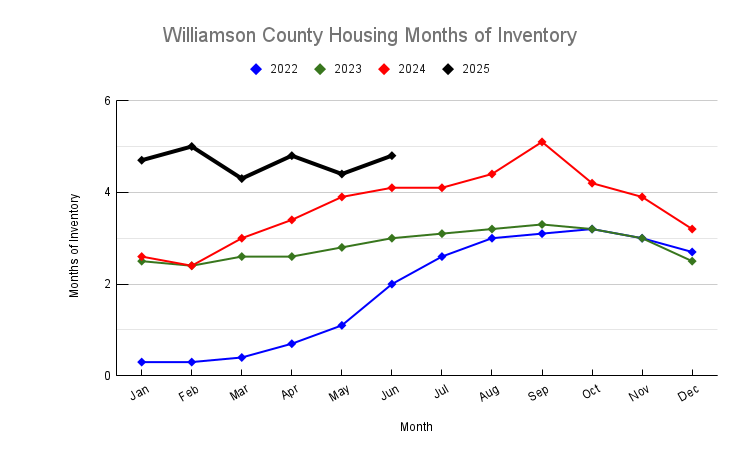
Interpretation:
- A healthy market typically hovers around 5–6 months.
- The jump from 2.0 (2022) to 4.8 (2025) suggests a clear shift toward oversupply, giving buyers more leverage.
- Inventory has grown due to slower sales and a consistent stream of new listings.
Closed Sales Trend
Closed sales peaked in May 2022 (1,210) and have shown a gradual decline:
| Month | Closed Sales |
|---|---|
| June 2022 | 1,179 |
| June 2023 | 1,075 |
| June 2024 | 945 |
| June 2025 | 909 |
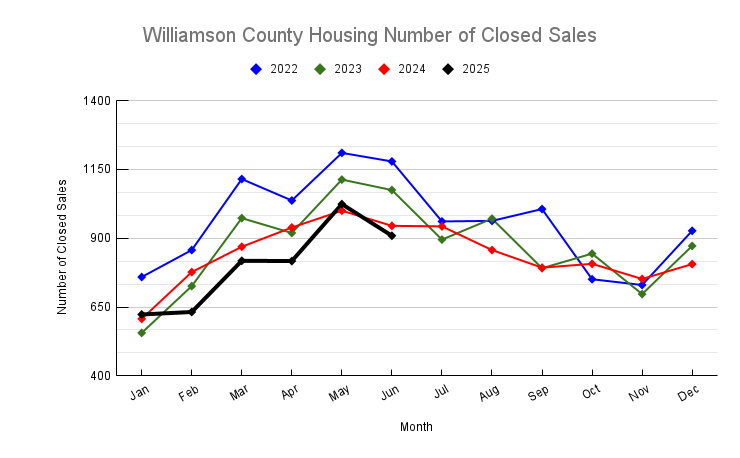
Over three years, June sales have dropped 23%, driven by:
- Higher interest rates
- Affordability concerns
- Buyer hesitancy amid economic uncertainty
While the market hasn’t collapsed, volume is consistently softening.
New Listings Trend
Contrary to closed sales, new listings have generally increased:
| Month | New Listings |
|---|---|
| June 2022 | 2,070 |
| June 2023 | 1,369 |
| June 2024 | 1,357 |
| June 2025 | 1,433 |
Though still below 2022’s levels, 2025 saw a 5.6% increase over 2024, suggesting more sellers are testing the market — possibly due to:
- Need to relocate
- Changing financial situations
- Attempting to time the market before further softening
However, more supply with less demand is pushing MOI higher.
Conclusion: A Market in Rebalancing
The Williamson County real estate market continues to undergo a post-pandemic correction. After the peak in mid-2022, prices have gradually declined and stabilized. Inventory levels are rising while buyer activity lags, creating conditions that favor buyers for the first time in years.
Buyers can benefit from increased choices and more negotiating room.
Sellers, on the other hand, must price strategically and prepare for longer listing periods.
Unless interest rates ease significantly or demand rebounds, we can expect continued price pressure and elevated inventory through the rest of 2025. The market is cooling — but it’s not crashing. It’s simply finding a new normal.
If you have any questions or need any assistance in finding your new home or investment property, please contact me and I will be more than happy to work with you. You can read my client testimonials here.
Please also check out our rebate program which is a win-win situation for my buyer.