The Austin and Central Texas residential real estate market continues to evolve as higher interest rates, affordability pressures, and growing inventory reshape buyer and seller behavior. Using Austin ABOR MLS data, we can compare the latest available month (November 2025) with the same month in 2024 and 2023, while also examining longer-term trends in pricing, inventory, sales activity, and listings across the region.

1. Year-over-Year Comparison: November 2025 vs. 2024 and 2023
In November 2025, the market shows clear signs of cooling compared to prior years:
-
Median Sale Price
- November 2023: $424,450
- November 2024: $435,000
- November 2025: $430,000
-
Closed Sales
- 2023: 2,065
- 2024: 2,130
- 2025: 1,895
-
Sales Dollar Volume
- 2023: $1.11B
- 2024: $1.19B
- 2025: $1.07B
-
Months of Inventory
- 2023: 3.7 months
- 2024: 4.8 months
- 2025: 6.3 months
-
New Listings
- 2023: 2,676
- 2024: 2,570
- 2025: 2,477
-
Active Listings
- 2023: 9,334
- 2024: 10,845
- 2025: 11,926
2. Median Sale Price Trend: From Rapid Growth to Stability
The median sale price tells the story of a market that has transitioned from explosive growth to stabilization:
- Prices surged in early 2022, peaking above $550,000.
- A steady correction followed throughout 2023 and 2024.
- In 2025, median prices largely hovered between $420,000 and $450,000.
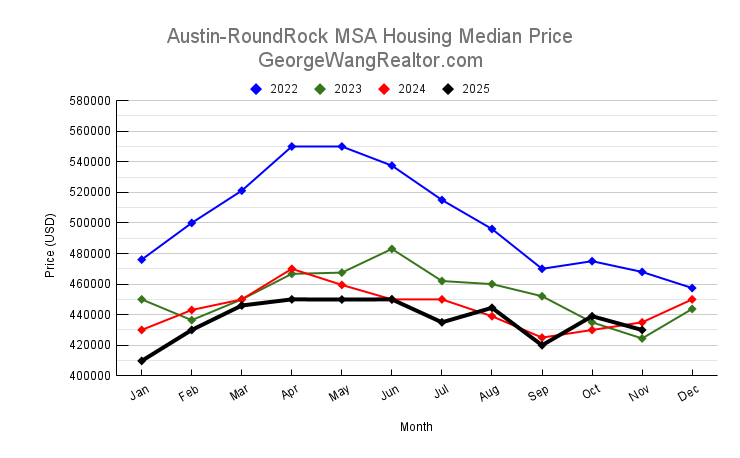
This pattern suggests the market has found a new equilibrium—lower than the peak but relatively stable compared to recent years. Buyers have regained negotiating power, while sellers are pricing more realistically.
3. Months of Inventory Trend: A Shift Toward Buyers
Months of inventory is one of the clearest indicators of market balance:
- 2022: Extremely tight conditions (often below 1 month early in the year).
- 2023–2024: Inventory gradually climbed into the 3–5 month range.
- 2025: Inventory consistently stayed above 5 months, reaching 6.3 months in November.
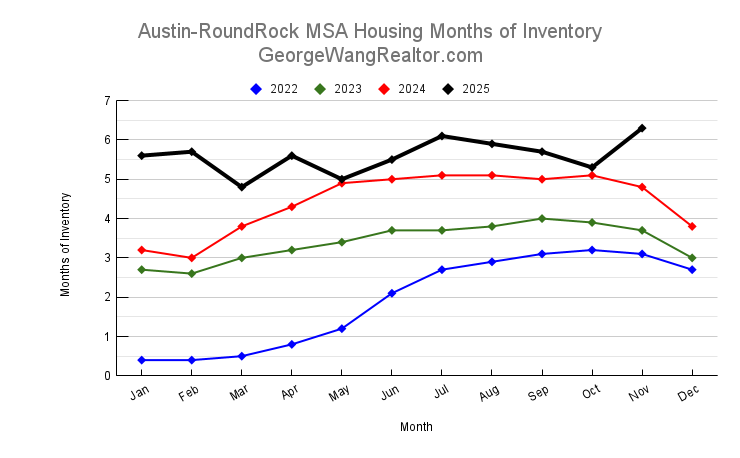
With six months of inventory commonly considered a balanced market, current levels strongly favor buyers, especially in price negotiations and concessions.
4. Closed Sales Trend: Demand Remains Muted
Closed sales activity has not returned to earlier highs:
- Peak activity occurred in 2022, with many months exceeding 3,000 sales.
- From 2023 onward, sales volumes moderated.
- In 2025, monthly closed sales mostly ranged between 1,800 and 2,700, with November marking one of the weaker months.
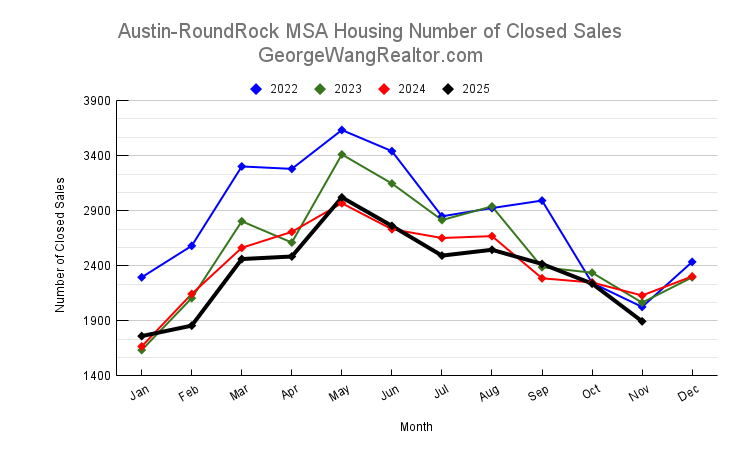
This reflects affordability constraints and cautious buyer sentiment, even as inventory improves.
5. New Listings Trend: Supply Continues to Build
New listings provide insight into seller confidence:
- Listing activity was extremely strong in 2022 and rebounded again in spring 2024 and 2025.
- While November 2025 new listings declined slightly, the cumulative effect has been a sharp rise in active listings, now near 12,000 homes.
- Sellers are entering the market, but homes are taking longer to sell.
This dynamic continues to apply downward pressure on prices and upward pressure on competition among sellers.
Conclusion: A More Balanced, Buyer-Friendly Market in 2025
The Austin and Central Texas housing market in late 2025 is fundamentally different from the frenzied conditions of 2021–2022. Prices have stabilized, inventory has expanded meaningfully, and buyers have far more leverage than in recent years. While demand remains steady, it is clearly more cautious, resulting in fewer closed sales and longer market times.
For buyers, today’s market offers opportunity, choice, and negotiating power. For sellers, success depends on accurate pricing, strong presentation, and realistic expectations. As the region moves into 2026, the data suggests a market that is healthier, more balanced, and driven by fundamentals rather than frenzy.
If you have any questions or need any assistance in finding your new home or investment property, please contact me and I will be more than happy to work with you. You can read my client testimonials here.
Please also check out our rebate program which is a win-win situation for my buyer.