
As the spring selling season kicks off, the March 2025 housing market data from the Abor MLS offers a clear picture of how the residential market is evolving across Central Texas. We’re diving into a detailed year-over-year comparison and several key metrics to understand what buyers, sellers, and investors should be aware of.


1. Median Sale Price: Softening Slightly
The median sale price dipped ever so slightly from $450,000 in March 2024 to $446,000 in March 2025, continuing a gentle downward trend that started after the peak of the market in 2022 ($521,100 in March). Over two years, the price has dropped by about 14.4%. This signals a continued market correction following the rapid price growth during the pandemic years.
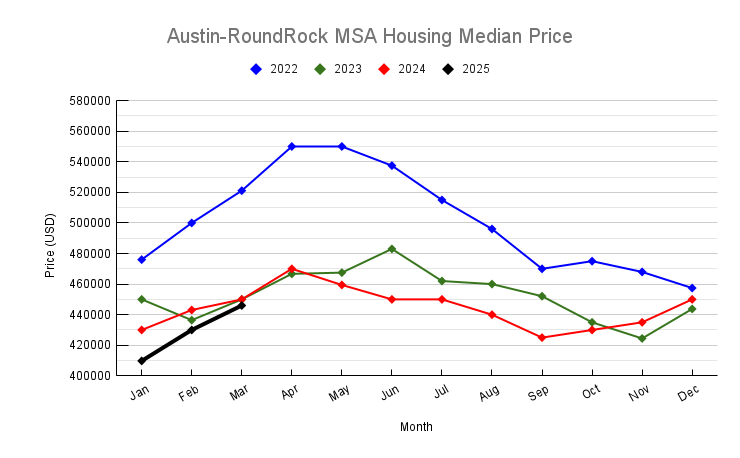
📌 Takeaway: Prices are stabilizing, giving buyers a bit more leverage.
2. Months of Inventory: A Market Rebalancing
One of the most striking changes is in the Months of Inventory, which rose from 3.0 in March 2023 to 4.8 in March 2025. This is approaching a more balanced market — typically defined as 5 to 6 months of inventory — after years of extreme seller dominance (e.g., 0.5 in March 2022).
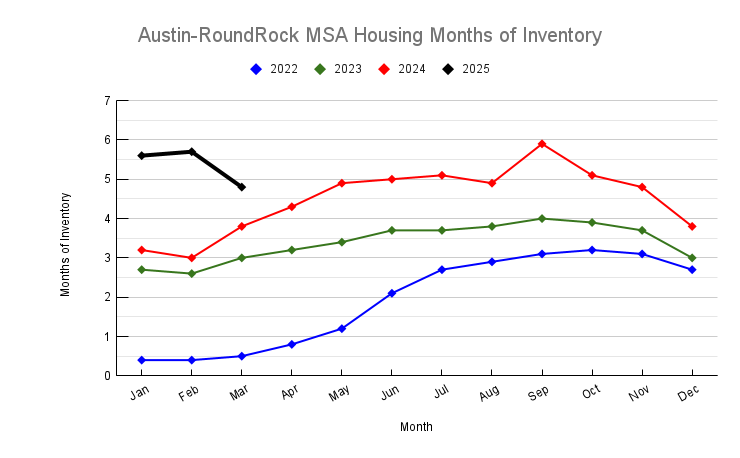
📌 Takeaway: The market is becoming more balanced, reducing upward pressure on home prices.
3. Closed Sales: Steady Decline
Closed sales saw a 4.0% decline year-over-year and a 12.2% drop compared to March 2023. This steady decrease suggests that buyers remain cautious, possibly influenced by mortgage rates, economic uncertainty, or affordability constraints.
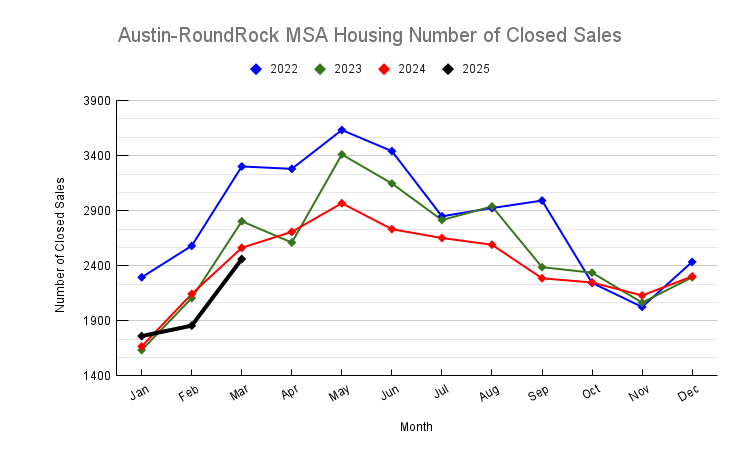
📌 Takeaway: Demand is softening slightly as the market adjusts to new pricing realities and broader economic conditions.
4. New Listings: Sellers Are Returning
There’s been a solid increase in new listings, up 9.1% from March 2024 and 17.2% from March 2023. This uptick could reflect homeowners capitalizing on still-relatively-high prices or relocating due to economic factors.
📌 Takeaway: More inventory means more choice for buyers and more competition for sellers.
5. Active Listings: Inventory Build-Up
Active listings have ballooned by 23.0% in a year and nearly 45% in two years — a sign that homes are taking longer to sell, and that not everything coming to market is moving quickly.
📌 Takeaway: Buyers now have more leverage, and sellers may need to be more flexible on pricing or concessions.
6. Days on Market: Holding Steady
The average days on market held fairly steady at 78 days, down just slightly from the previous years. While it’s still higher than the fast-paced market of 2022, this shows a stabilization — not a full slowdown.
📌 Takeaway: Homes are selling, but buyers are taking their time and being selective.
Final Thoughts
The March 2025 data points to a market in transition. After the whirlwind years of soaring prices and low inventory, Central Texas real estate is moving toward a more balanced dynamic. Prices are slightly down, inventory is up, and both buyers and sellers are recalibrating.
If you’re buying: You have more negotiating power and more homes to choose from. If you’re selling: Pricing competitively and staging well are key.