The Central Texas real estate market has undergone a significant transformation over the past four years. From the record-breaking highs of 2022 to the inventory-rich environment of 2025 and 2026, the data reveals a market that is searching for a new equilibrium. Below is a detailed analysis of the latest statistics and long-term trends.

1. Year-over-Year Comparison: January 2026 vs. 2025 & 2024
Comparing the latest data from January 2026 with the same month in previous years highlights a cooling trend in prices and a stabilization in inventory levels.
- Median Sale Price: January 2026 saw a median price of $400,495, a decrease of 2.26% compared to January 2025 ($409,765) and a 6.86% drop from January 2024 ($430,000).
- Closed Sales: There were 1,566 closed sales in January 2026. This represents an 11% decrease from the 1,761 sales in January 2025 and a 6% decrease from January 2024 (1,667 sales).
- Months of Inventory: Inventory levels stood at 4.0 months in January 2026. While this is lower than the 5.6 months seen in January 2025, it remains higher than the 3.2 months recorded in January 2024, indicating a market that is more balanced than the extreme seller’s market of years past.
- New Listings: New listings for January 2026 totaled 3,470, a slight dip from 3,690 last year but higher than the 3,064 seen in 2024.
2. Median Sale Price Trend: A Path Toward Affordability
The median sale price in Travis County peaked in the spring of 2022, reaching $550,000 in April and May. Since then, the market has seen a gradual correction.
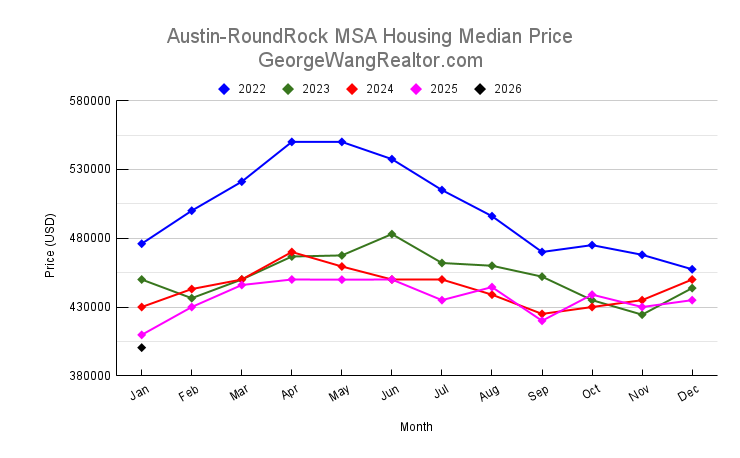
- Correction Phase: Throughout 2023 and 2024, prices fluctuated mostly between $425,000 and $470,000.
- Current State: By early 2026, the median price dipped to its lowest point in the provided dataset at $400,495. This downward trend suggests that the market is adjusting to higher interest rates and increased supply, offering some relief to prospective buyers who were priced out during the 2022 boom.
3. Months of Inventory: From Scarcity to Surplus
Months of inventory is a key indicator of market balance.
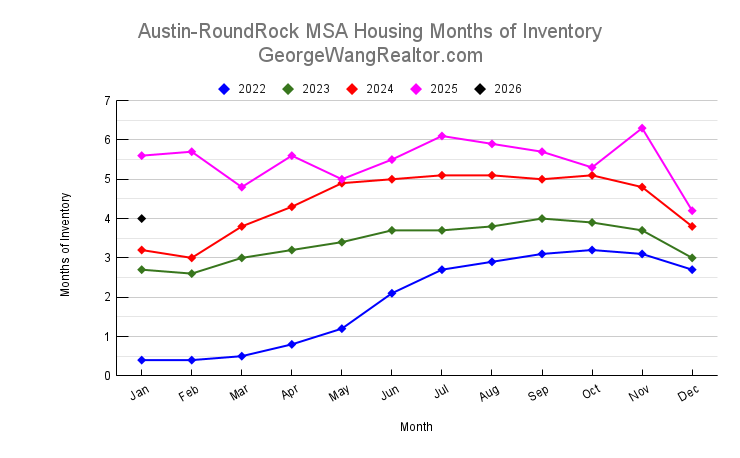
- Extreme Scarcity (2022): In early 2022, inventory was at a critical low of 0.4 months, signifying a “red-hot” seller’s market where demand vastly outpaced supply.
- Growing Supply: Inventory began to climb steadily through 2023 and 2024, peaking at 6.3 months in November 2025.
- Equilibrium: The current 4.0 months of inventory suggests a “neutral” market. A market is generally considered balanced when it has 5 to 6 months of supply; the current data shows the market is moving closer to this healthy range.
4. Closed Sales: Seasonal Rhythms and Volume Shifts
Closed sales data continues to follow a strong seasonal pattern, with activity peaking in the summer months and bottoming out in the winter.
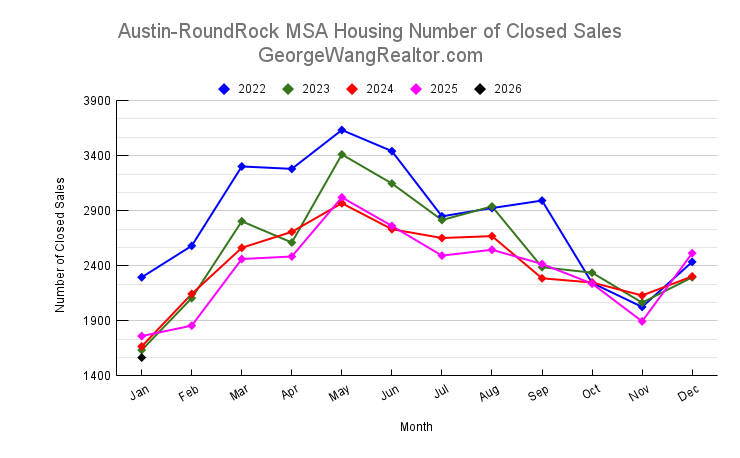
- Peak Activity: The highest volume of sales occurred in May 2022 (3,633 sales) and May 2023 (3,411 sales).
- Recent Volume: While 2025 maintained steady volume, with a peak of 3,021 sales in May, the start of 2026 has shown a slower pace. The 1,566 sales in January 2026 represent the lowest monthly total in the four-year period, reflecting a cautious approach from both buyers and sellers at the start of the year.
5. New Listings: Sustained Supply
The flow of new properties onto the market has remained relatively robust over the last two years.
- High Supply Years: 2025 saw several months where new listings exceeded 5,000 (notably April and May).
- Current Momentum: With 3,470 new listings in January 2026, the supply side remains active. Even as sales volume has moderated, the consistent influx of new listings has contributed to the higher active listing counts (reaching over 10,000 in January 2026), providing buyers with more choices than they had during the 2022-2023 period.
Conclusion
The Travis County real estate market has shifted from the frantic, low-inventory environment of 2022 into a more measured and accessible landscape in early 2026. With median prices softening to around $400,000 and inventory holding steady at 4.0 months, the market is currently more favorable for buyers than it has been in years. However, the drop in closed sales volume suggests that high borrowing costs or economic uncertainty may still be keeping some participants on the sidelines. As we move into the spring buying season, all eyes will be on whether the current inventory levels can stimulate a rebound in sales activity.
If you have any questions or need any assistance in finding your new home or investment property, please contact me and I will be more than happy to work with you. You can read my client testimonials here.
Please also check out our rebate program which is a win-win situation for my buyer.