
AUSTIN, TX — According to the Austin Board of REALTORS®June and Mid-Year 2022 Central Texas Housing Market Report, a triple-digit gain in active listings year over year pushed housing inventory levels over two months in the Austin-Round Rock MSA for the first time since November 2019. Combined with a dip in residential home sales activity and slowing pace of home price growth in June, the data indicates a decelerating Austin housing market that is beginning to return to pre-COVID normalcy.

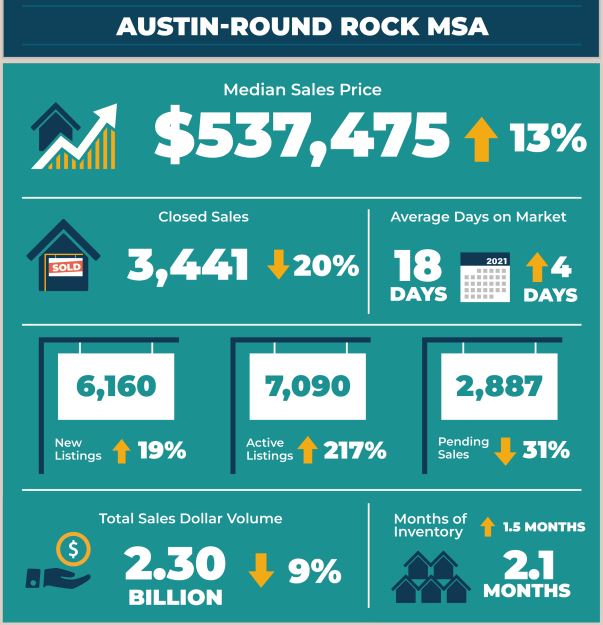
Last month across the MSA, residential home sales declined 20.3% year over year to 3,441 closed sales as the median price rose 13%, setting a record of $537,475 for the month of June. Sales dollar volume dropped 9.9% to $2,301,865,479 while new listings jumped 19.6% to 6,160 listing.
The number of homes on the market skyrocketed 217.8% to 7,090 active listings, causing housing inventory to jump to 2.1 months of inventory, up 1.5 months from last June. While pending sales dropped 31.6% to 2,887 transactions, homes still went under contract quickly, spending an average of 18 days on the market or four more days than June 2021.
Austin-Round Rock MSA
In the first half of 2022, home sales in the Austin-Round Rock MSA decreased 7.7% year over year to 18,430 home sales. Sales dollar volume rose 7.7% to $11,904,623,551, while the median price increased 19.7% to $525,000. So far this year, new listings are up 7.3% to 25,622 new listings; active listings skyrocketed 90.6% to 3,044 active listings; and pending sales decreased 12.1% to 19,305 pending sales. Homes spent an average of 21 days on the market from January through June 2022, one fewer day than the same period in 2021.
City of Austin
In the City of Austin, home sales in the first half of the year decreased 10.7% year over year to 5,789 sales, while the median price increased 15.1% to $610,000. At the same time, sales dollar volume rose 2.4% to $4,372,274,870. New listings decreased 0.8% to 7,788 listings; active listings increased 39.4% to 832 listings; and pending sales dropped 17.8% to 5,903 pending sales.
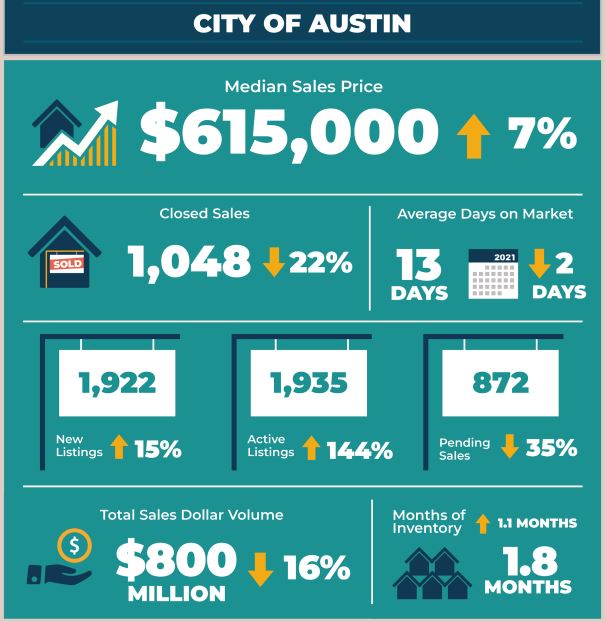
This June, home sales dropped 22.9% year over year to 1,048 sales. At the same time, sales dollar volume decreased 16.1% to $800,231,967, while the median price rose 7.9% to $615,000–setting a record for the month of June. During the same period, new listings increased 15% to 1,922 listings; active listings skyrocketed 144.9% to 1,935 active listings; and pending sales tumbled 35.5% to 872 sales. Housing inventory increased 1.1 months of inventory to 1.8 months of inventory.
Travis County
From January through June in Travis County, home sales decreased 11.4% year over year to 8,920 sales. During the same period, sales dollar volume rose 0.9% to $6,716,534,179, as the median price increased 17.2% to $597,500. New listings saw an uptick of 2.9% to 12,266 listings, while active listings rose 58% to 1,420 listings. Pending sales fell 15.5% to 9,110 pending sales.
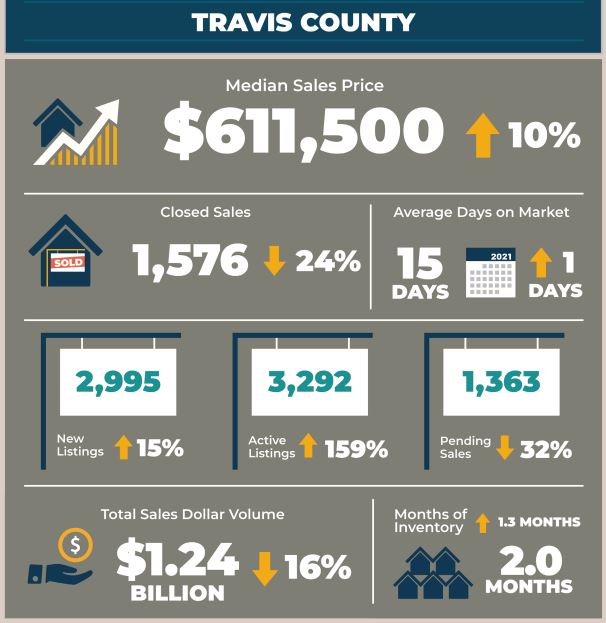
In June 2022, home sales decreased 24.7% year over year to 1,576 sales, while sales dollar volume dropped 16.1% to $1,240,583,715. During the same period, the median price increased 10.2% to $611,500. New listings increased 15.6% to 2,995 listings; active listings jumped 159.2% to 3,292 listings; while pending sales dropped 32.9% to 1,363 sales. Housing inventory rose 1.3 months to 2 months of inventory.
Williamson County
In Williamson County, home sales in the first half of 2022 decreased 6.4% year over year to 6,116 home sales. During the same period, sales dollar volume increased by 14.1% to $3,360,779,966, and the median price rose 20.9% to $495,783. New listings ticked up 5.3% to 8,414 listings; active listings soared 131% to 910 listings, while pending sales fell 13.9% to 6,345 pending sales.
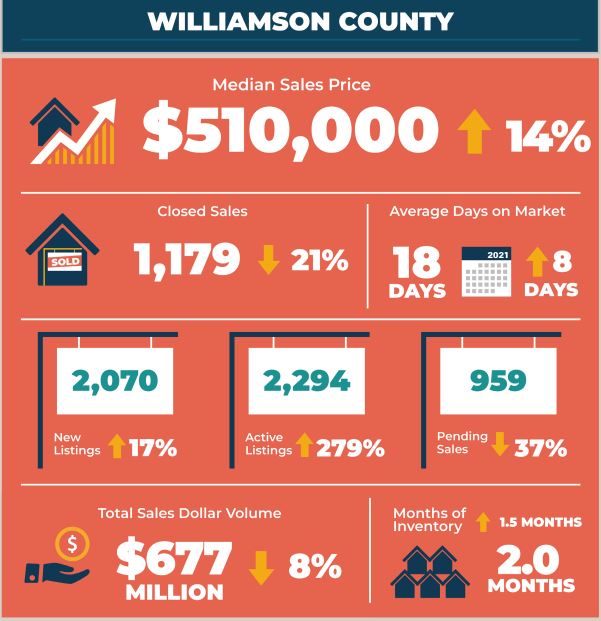
This June, home sales decreased 21.8% year over year to 1,179 sales. During the same period, sales dollar volume dropped 8.6% to $677,528,395, and the median price climbed 14.6% to $510,000. New listings increased 17.8% to 2,070 listings, while active listings also skyrocketed 279.8% to 2,294 listings. Pending sales fell 37% to 959 pending sales. Housing inventory more than doubled to 2 months of inventory.
Hays County
In the first half of 2022, Hays County home sales ticked down 1.4% year over year to 2,369 sales, and sales dollar volume rose 22.6% to $1,377,122,510. During the same period, the median price increased 27.1% to $445,000. New listings increased 14.4% to 3,370 listings; active listings jumped 151% to 482 listings; and pending sales fell 4.3% to 2,664 pending sales.
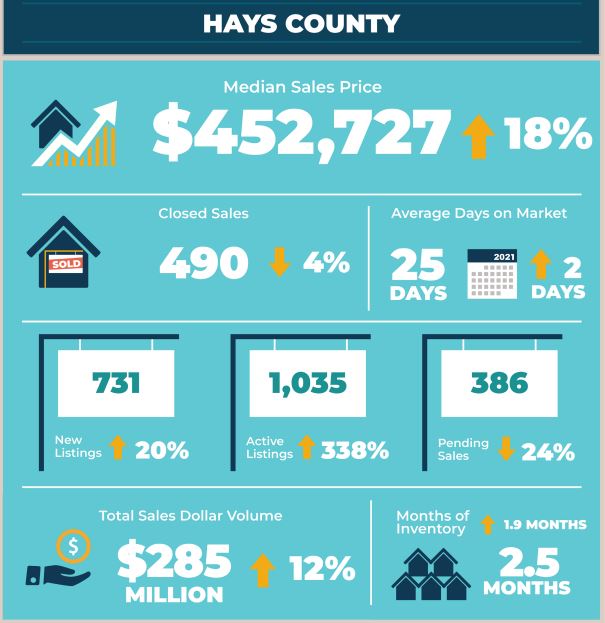
In June 2022, home sales decreased 4.1% year over year to 490 home sales, as sales dollar volume rose 12.2% to $285,813,956. During the same period, the median price climbed 18.1% to $452,727. New listings increased 20.8% to 731 listings; active listings soared 338.6% to 1,035 listings; and pending sales dropped 24% to 386 pending sales. Inventory increased 1.9 months to 2.5 months of inventory.
Bastrop County
In the first half of 2022, Bastrop County home sales slightly fell 1.1% year over year to 779 home sales, and sales dollar volume increased 33.1% to $356,826,561. The median sales price increased 39.8% to $405,500. During the same period, new listings rose 38.5% to 1,177 listings, as active listings jumped 128.4% to 185 listings. At the same time, pending sales ticked up 0.9% to 857 pending sales.
In June 2022, home sales increased 1.2% year over year to 163 home sales, and sales dollar volume rose 30.2% to $82,127,408. At the same time, the median price increased 29.7% to $420,250. New listings jumped 84.2% to 280 listings; active listings skyrocketed 325.3% to 387 active listings, while pending sales fell flat at 124 pending sales. Inventory jumped 2.3 months to 3 months of inventory.
Caldwell County
To date in 2022, Caldwell County home sales increased 32.3% year over year to 246 sales, and sales dollar volume increased 59.2% to $90,032,286. The median price climbed 33.6% to $335,000 During the same period, new listings jumped 114.7% to 395 listings; active listings rose 46.7% to 44 listings, while pending sales also increased 85.9% to 329 pending sales.
In June 2022, home sales dropped 23.3% year over year to 33 home sales, and sales dollar volume fell 14.6% to $13,022,017. During the same period, the median price rose 7.1% to $331,950. New listings increased 90.9% to 84 listings; active listings soared 173.3% to 82 listings. Pending sales increased 52.8% to 55 pending sales. Housing inventory jumped 1.3 months to 2.2 months of inventory.