
AUSTIN, Texas — The Austin-Round Rock MSA housing market is outperforming national trends while continuing to balance, according to the Austin Board of REALTORS® April 2023 Central Texas Housing Market Report. The most recent National Association of REALTORS® data (March 2023) found that home sales declined 22.7% nationally while in Central Texas, they declined 14%, demonstrating resilience of the region’s economy.

Last month, Austin-Round Rock housing inventory increased 2.4 months to 3.2 months of inventory, and homes spent an average of 71 days on the market, up 53 days from April 2022.
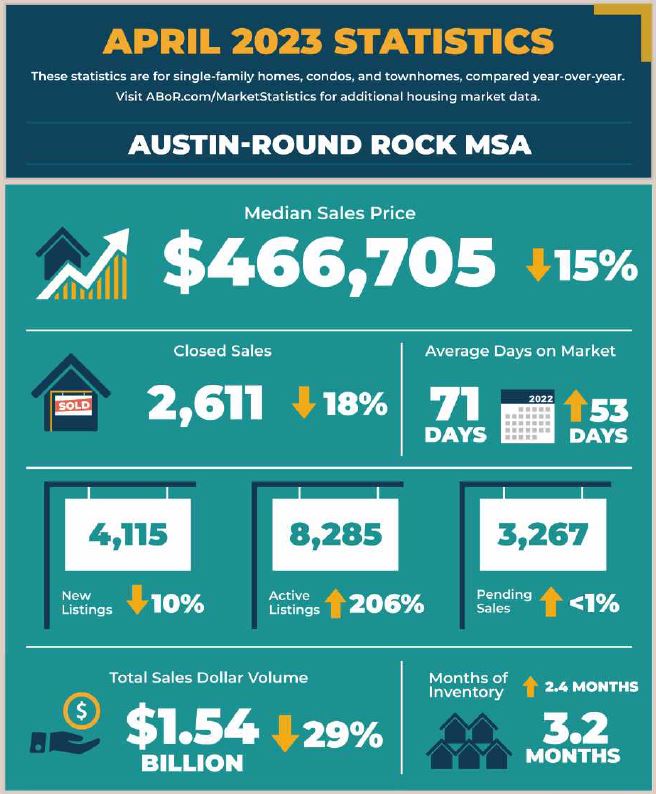
The median home price fell 15.1% to $466,705 while residential home sales also declined 18.8% year-over-year to 2,611 closed sales and sales dollar volume dropped 29.3% to $1,545,088,361. New listings declined 10.6% year-over-year to 4,115 listings while pending sales rose 0.2% to 3,267 transactions.
City of Austin
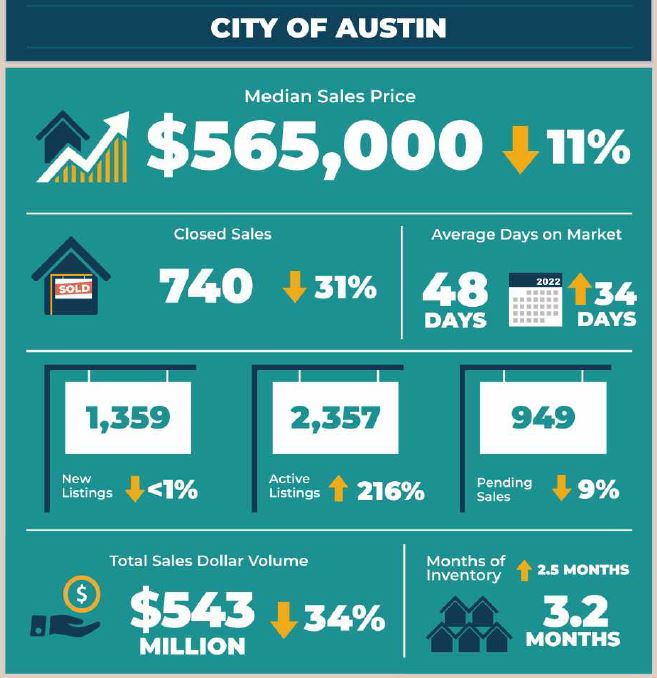
In April, home sales decreased 31.0% to 740 sales, while sales dollar volume decreased 34.8% to $543,967,464. At the same time, median price decreased 11.4% to $565,000 for the City of Austin. Last month, new listings slightly decreased 0.6% to 1,359 listings, active listings skyrocketed 216.0% to 2,357 listings as pending sales declined by 9.9% to 949 pending sales. Monthly housing inventory increased 2.5 months year over year to 3.2 months of inventory.
Travis County
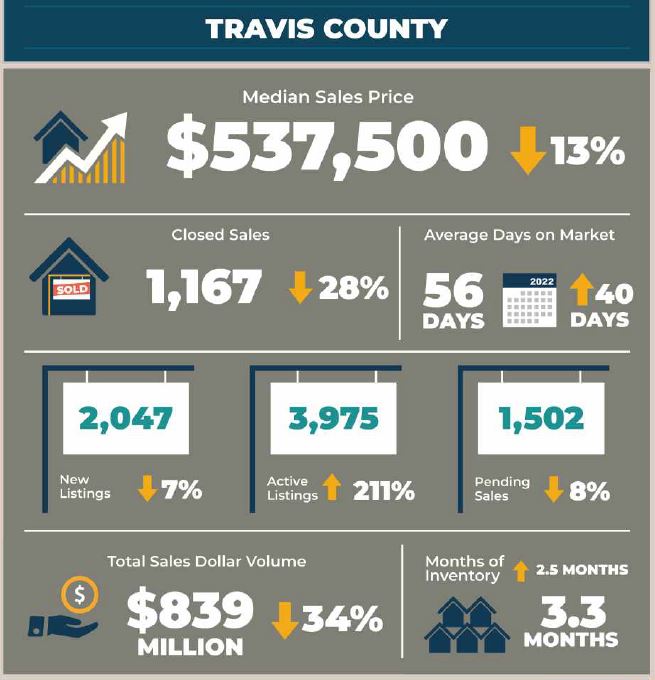
In Travis County, home sales decreased 28.6% to 1,167 sales, while sales dollar volume dropped 34.9% to $839,004,026. Last month, the median price in Travis County dipped 13.3% year over year to $537,500, new listings decreased 7.7% to 2,047 listings and active listings ballooned 211.5% to 3,975 listings year over year. Pending sales declined 8.5% to 1,502 pending sales as monthly housing inventory increased 2.5 months year over year to 3.3 months of inventory.
Williamson County
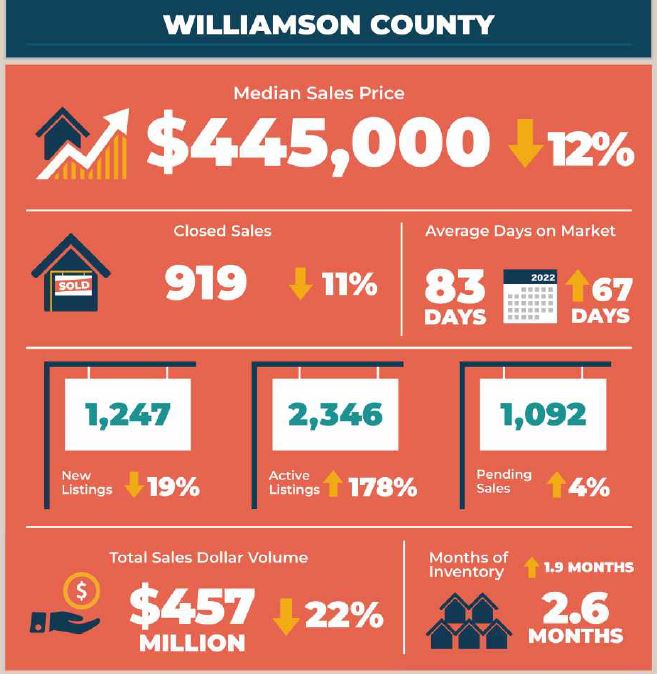
April home sales decreased 11.2% to 919 sales and sales dollar volume declined 22.2% year over year to $457,918,942 in Williamson County. The median price decreased 12.8% to $445,000 as new listings also decreased 19.8% to 1,247 listings. During the same period, active listings soared 178.0% to 2,346 listings while pending sales slightly rose 4.7% to 1,092 pending sales. Housing inventory rose 1.9 months to 2.6 months of inventory.
Hays County
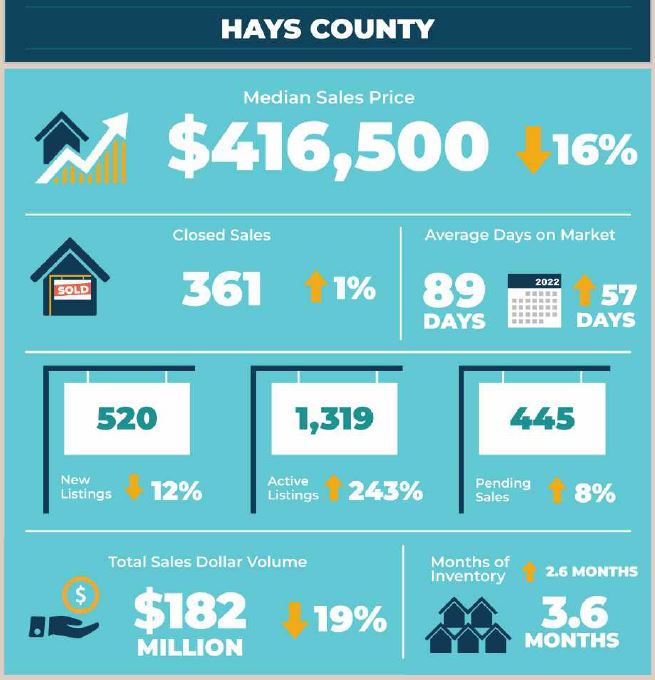
In Hays County, April home sales rose slightly 1.1% to 361 sales while sales dollar volume dropped 19.0% to $182,586,736. The median price for homes fell 16.9% to $416,500. During the same period, new listings decreased 12.2% to 520 listings, while active listings skyrocketed by 243.5% to 1,319 listings. Pending sales increased 8.5% to 445 pending sales as housing inventory jumped by 2.6 months to 3.6 months of inventory.
Bastrop County
Last month, Bastrop County home sales decreased 14.1% year over year to 122 sales, while sales dollar volume also decreased 24.1% to $49,966,019. Median price dipped 5.3% to $380,000 as new listings ticked up 22.9% to 215 listings. Active listings soared 220.9% to 507 listings as pending sales also increased 35.8% to 167 pending sales. Housing inventory increased by 2.9 months to 4.1 months of inventory, the highest level of inventory across the MSA in April.
Caldwell County
In Caldwell County, home sales decreased 14.3% to 42 closed sales, and sales dollar volume dropped 17.3% to $14,423,495. The median home price fell 15.1% year over year to $297,000. At the same time, new listings increased by 38.7% to 86 listings as active listings skyrocketed 245.0% to 138 listings. Pending sales increased 35.6% to 61 pending sales, and housing inventory increased 2.1 months to 3.3 months of inventory.
For more information or to download the April 2023 Central Texas Housing Market Report, visit ABoR.com/MarketStatistics.