
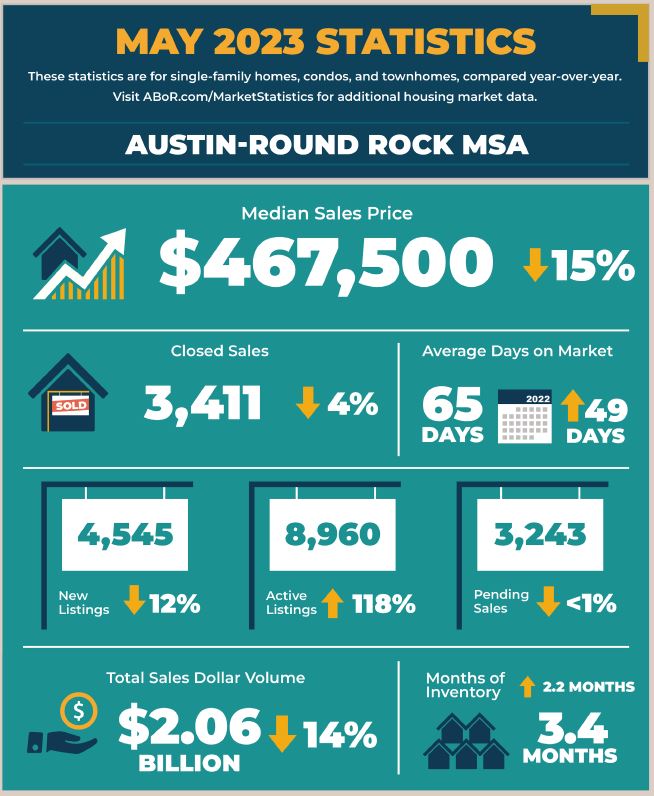
AUSTIN, Texas — In May, home buyers and sellers saw more opportunity across the Austin-Round Rock MSA according to the Austin Board of REALTORS® May 2023 Central Texas Housing Market Report. Housing inventory grew 2.2 months to 3.4 months of inventory and active listings soared 118.9% to 8,960 active listings indicating buyers and sellers view the market as a more favorable environment than in recent months.

In May, pending sales across the MSA slightly dipped 0.5% to 3,243 pending sales, while homes spent an average of 65 days on the market, up 49 days from May 2022. The median home price declined 15.0% to $467,500 while residential home sales also decreased 4.2% year-over-year to 3,411 closed sales. At the same time, sales dollar volume dropped 14.8% to $2,068,145,860.
City of Austin
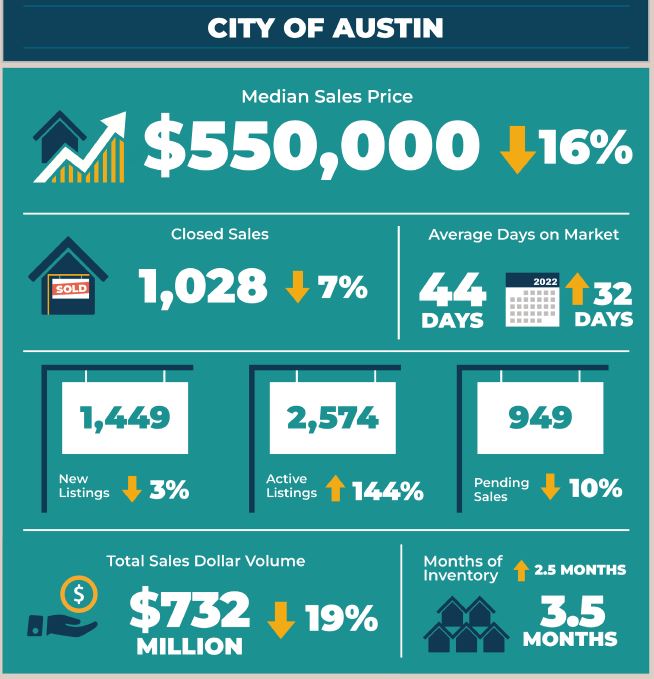
In May, home sales slightly decreased 7.6% to 1,028 sales, while sales dollar volume fell 19.6% to $732,218,904. At the same time, the median price declined 16.7% to $550,000 for the City of Austin. Last month, new listings slightly fell 3.7% to 1,449 listings, active listings skyrocketed 144.0% to 2,574 listings as pending sales declined by 10.1% to 949 pending sales. Monthly housing inventory increased 2.5 months year over year to 3.5 months of inventory.
Travis County
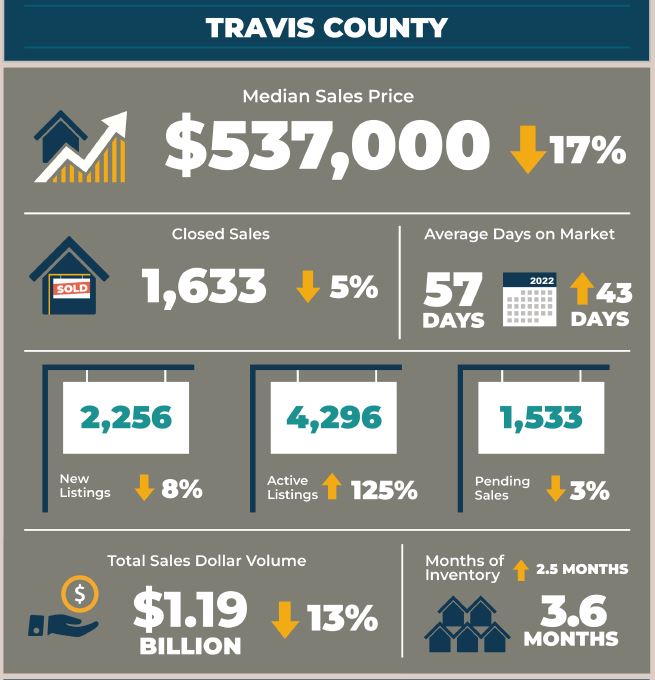
In Travis County, home sales dipped 5.1% to 1,633 sales, while sales dollar volume also dropped 13.7% to $1,198,970,260. Last month, the median price in Travis County fell 17.4% year over year to $537,000, new listings decreased 8.1% to 2,256 listings and active listings ballooned 125.4% to 4,296 listings year over year. Pending sales declined 3.0% to 1,533 pending sales as monthly housing inventory increased 2.5 months year over year to 3.6 months of inventory.
Williamson County
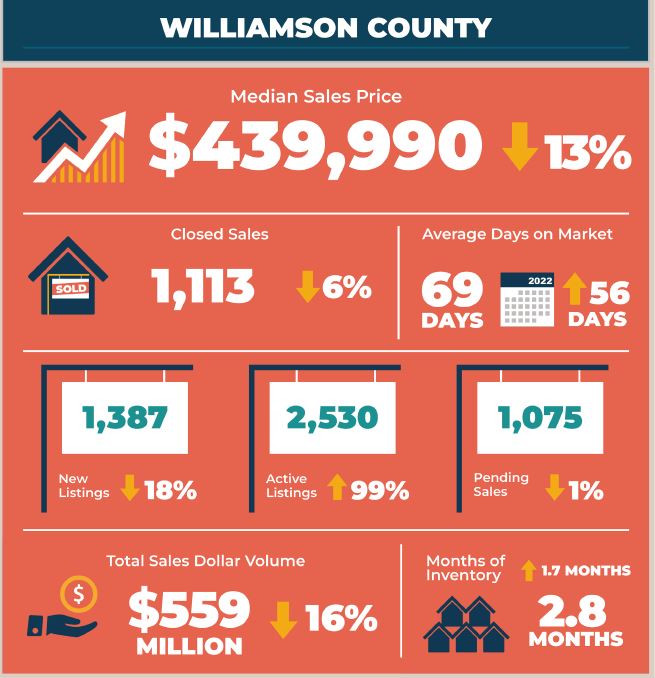
May home sales decreased 6.7% to 1,113 sales and sales dollar volume declined 16.8% year over year to $559,090,028 in Williamson County. The median price decreased 13.7% to $439,990 as new listings also decreased 18.1% to 1,387 listings. During the same period, active listings increased 99.5% to 2,530 listings while pending sales slightly fell 1.2% to 1,075 pending sales. Housing inventory rose 1.7 months to 2.8 months of inventory.
Hays County
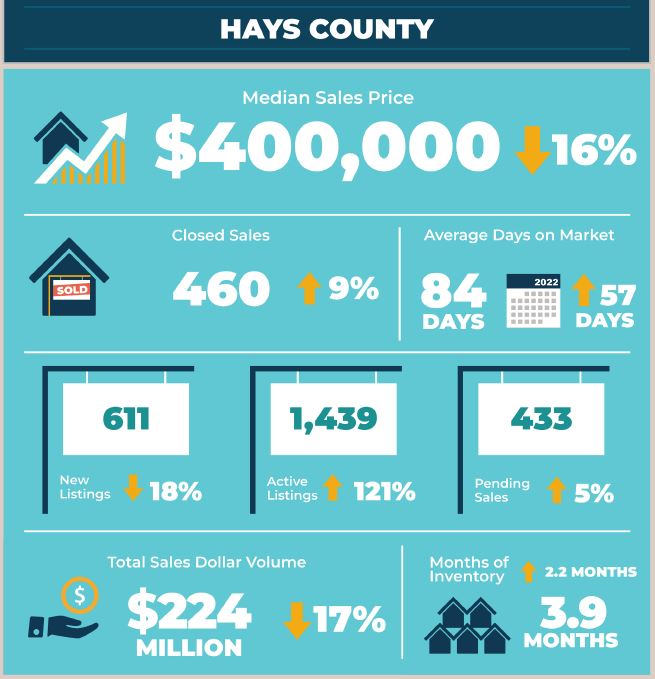
In Hays County, May home sales rose 9.5% to 460 sales while sales dollar volume dropped 17.1% to $224,503,192. The median price for homes fell 16.1% to $400,000. During the same period, new listings decreased 18.6% to 611 listings, while active listings skyrocketed by 121.4% to 1,439 listings. Pending sales increased 5.6% to 433 pending sales as housing inventory jumped by 2.2 months to 3.9 months of inventory.
Bastrop County
Last month, Bastrop County home sales slightly decreased 4.2% year over year to 158 sales, while sales dollar volume also fell 7.1% to $67,537,423. Median price dipped 7.7% to $369,900 as new listings ticked down 1.8% to 224 listings. Active listings soared 151.1% to 555 listings as pending sales increased 1.4% to 142 pending sales. Housing inventory increased by 2.8 months to 4.5 months of inventory, the highest level of inventory across the MSA in May.
Caldwell County
In Caldwell County, home sales decreased 25.4% to 47 closed sales, and sales dollar volume dropped 26.1% to $16,751,072. The median home price fell 9.6% year over year to $312,000. At the same time, new listings increased by 11.7% to 67 listings as active listings skyrocketed 191.7% to 140 listings. Pending sales rose 46.3% to 60 pending sales, and housing inventory increased 2.2 months to 3.5 months of inventory.
For more information or to download the May 2023 Central Texas Housing Market Report, visit ABoR.com/MarketStatistics.