
AUSTIN, TX — During the first six months of 2023, the Austin-Round Rock MSA housing market remained robust and continued to normalize despite macroeconomic factors impacting the housing market and economy, according to the Austin Board of REALTORS® Central Texas Housing Market Report. Despite increased inventory across the region, long-term solutions to address affordability and housing availability are still needed. ABoR will once again convene experts from across the community this month to continue advancing housing solutions designed to ensure the future of the region’s housing market is equitable and sustainable.

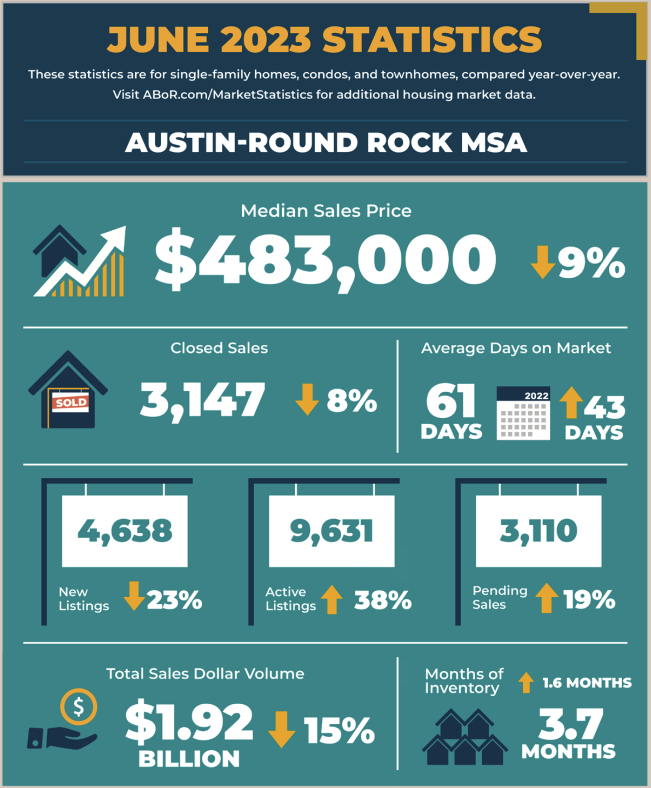
Last month across the MSA, residential home sales declined 8.5% year over year to 3,147 closed sales while the median price also dropped 9.6% to $483,000 for the month of June. Sales dollar volume fell 15.6% to $1,921,766,942 and new listings declined 23.6% to 4,638 listings.
The number of homes on the market jumped 38.4% to 9,631 active listings, causing housing inventory to skyrocket to 3.7 months of inventory, up 1.6 months from last June. Pending sales increased 19.1% to 3,110 transactions and homes spent an average of 61 days on the market, 43 more days than June 2022.
Austin-Round Rock MSA
In the first half of 2023, home sales in the Austin-Round Rock MSA decreased 14.5% year over year to 15,632 home sales. Sales dollar volume dropped 23.2% to $9,076,088,439, as the median price fell 12.8% to $458,000. So far this year, new listings are down 7.8% to 23,366 new listings; active listings skyrocketed 173.5% to 8,180 listings; and pending sales decreased 6.7% to 17,012 pending sales. Homes spent an average of 72 days on the market from January through June 2023, 51 more days than the same period in 2022.
City of Austin
In the City of Austin, home sales in the first half of the year decreased 22.4% year over year to 4,490 sales, as the median price also fell 10.7% to $545,000. At the same time, sales dollar volume dropped 27.1% to $3,180,556,219. New listings slightly ticked down 2.7% to 7,571 listings; active listings soared 170.2% to 2,243 listings; and pending sales dropped 14.8% to 4,918 pending sales.
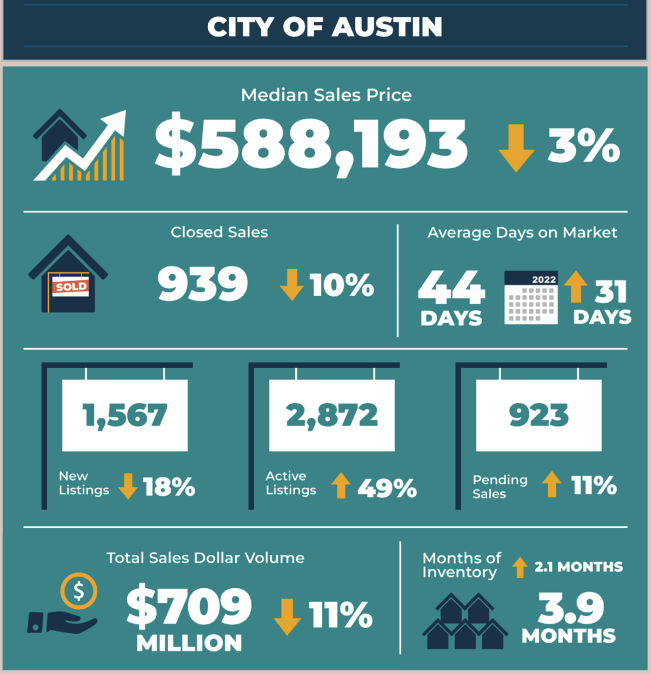
This June, home sales dropped 10.6% year over year to 939 sales. At the same time, sales dollar volume decreased 11.3% to $709,176,366, while the median price dropped 3.6% to $588,193. During the same period, new listings fell 18.3% to 1,567 listings; active listings increased 49.2% to 2,872 active listings; and pending sales ticked up 11.9% to 923 sales. Housing inventory increased 2.1 months of inventory to 3.9 months of inventory.
Travis County
From January through June in Travis County, home sales decreased 19.4% year over year to 7,187 sales. During the same period, sales dollar volume fell 25.5% to $4,998,478,556, as the median price dropped 12.8% to $521,000. New listings also ticked down 4.1% to 11,727 listings, while active listings skyrocketed 171.4% to 3,829 listings. Pending sales fell 11.2% to 7,850 pending sales.
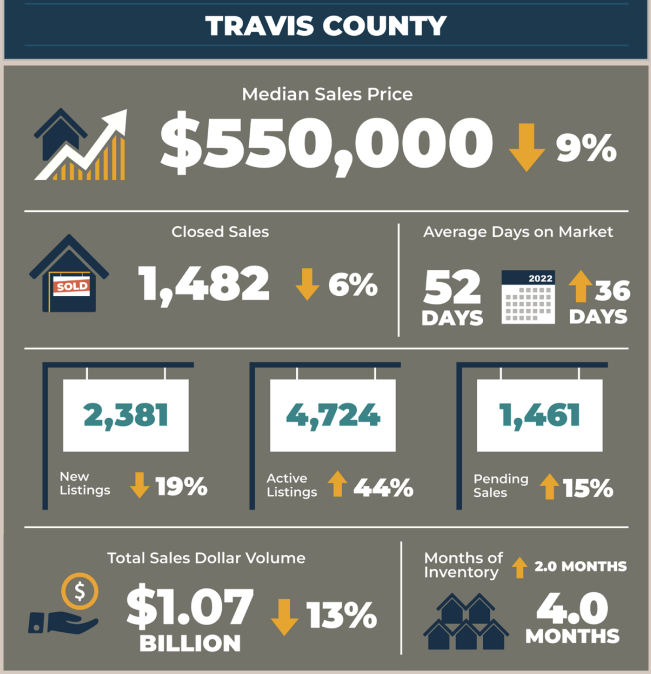
In June 2023, home sales decreased 6.7% year over year to 1,482 sales, while sales dollar volume dropped 13.1% to $1,076,495,140. During the same period, the median price fell 9.8% to $550,000. New listings dropped 19.8% to 2,381 listings; active listings increased 44.8% to 4,724 listings; while pending sales jumped 15.7% to 1,461 sales. Housing inventory rose 2.0 months to 4.0 months of inventory.
Williamson County
In Williamson County, home sales in the first half of 2023 decreased 12.8% year over year to 5,353 home sales. During the same period, sales dollar volume fell by 21.4% to $2,644,915,637, and the median price dropped 12.1% to $435,000. New listings decreased 17.6% to 6,931 listings; active listings soared 165.8% to 2,411 listings, while pending sales slightly fell 5.1% to 5,725 pending sales.
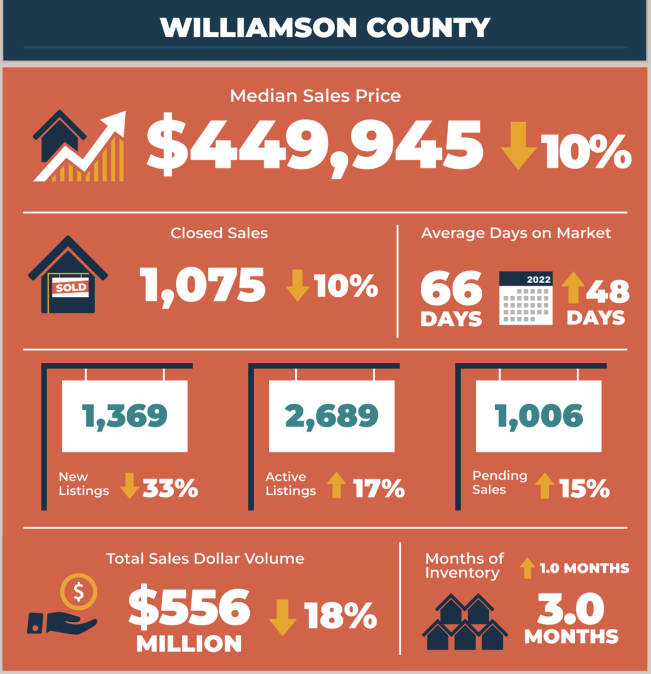
This June, home sales decreased 10.3% year over year to 1,075 sales. During the same period, sales dollar volume dropped 18.1% to $556,092,718, and the median price also fell 10.9% to $449,945. New listings decreased 33.6% to 1,369 listings, while active listings increased 17.5% to 2,689 listings. Pending sales also rose 15.6% to 1,006 pending sales. Housing inventory increased 1.0 months to 3.0 months of inventory.
Hays County
In the first half of 2023, Hays County home sales ticked down 1.8% year over year to 2,155 sales, and sales dollar volume dropped 17.9% to $1,074,567,401. During the same period, the median price fell 11.2% to $404,165. New listings slightly rose 0.3% to 3,161 listings; active listings soared 190.6% to 1,299 listings; and pending sales increased 4.8% to 2,375 pending sales.
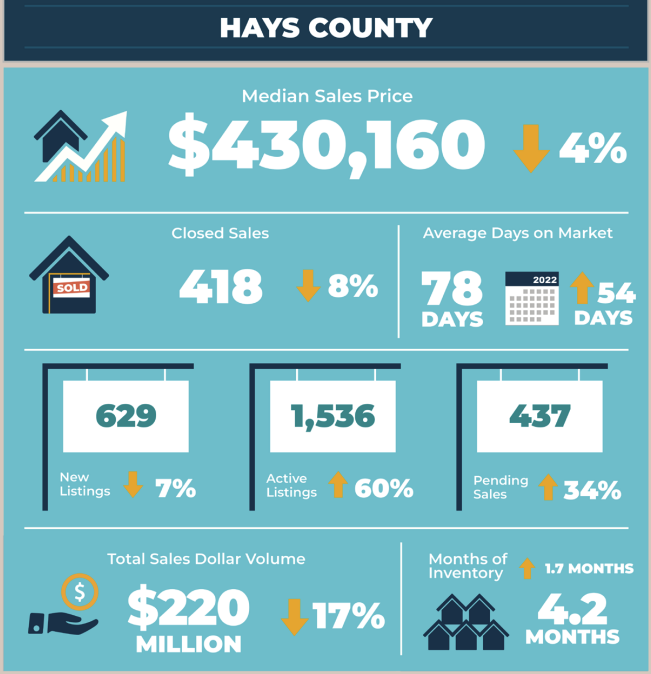
In June 2023, home sales decreased 8.9% year over year to 418 home sales, as sales dollar volume also decreased 17.3% to $220,701,935. During the same period, the median price dipped 4.7% to $430,160. New listings decreased 7.9% to 629 listings; active listings soared 60.8% to 1,536 listings; and pending sales rose 34.5% to 437 pending sales. Inventory increased 1.7 months to 4.2 months of inventory.
Bastrop County
In the first half of 2023, Bastrop County home sales fell 10.1% year over year to 698 home sales, and sales dollar volume decreased 21.2% to $278,996,295. The median sales price dropped 12.1% to $354,950. During the same period, new listings slightly fell 0.3% to 1,159 listings, as active listings jumped 179.2% to 511 listings. At the same time, pending sales ticked down 3.8% to 771 pending sales.
In June 2023, home sales decreased 23.9% year over year to 124 home sales, and sales dollar volume dropped 35.8% to $51,605,661. At the same time, the median price fell 15.0% to $352,760. New listings dropped 26.9% to 198 listings; active listings increased 43.9% to 544 active listings, while pending sales also increased 45.3% to 154 pending sales. Inventory jumped 1.7 months to 4.6 months of inventory.
Caldwell County
To date in 2023, Caldwell County home sales slightly fell 2.9% year over year to 239 sales, and sales dollar volume decreased 11.1% to $79,050,554. The median price dropped 11.0% to $298,075. During the same period, new listings ticked up 0.3% to 388 listings; active listings skyrocketed 204.8% to 128 listings, while pending sales dropped 4.3% to 291 pending sales.
In June 2023, home sales increased 50.0% year over year to 48 home sales, and sales dollar volume increased 39.3% to $16,250,960. During the same period, the median price fell 15.6% to $276,000. New listings dropped 23.8% to 61 listings; active listings increased 81.6% to 138 listings. Pending sales rose 8.3% to 52 pending sales. Housing inventory jumped 1.2 months to 3.3 months of inventory.
For more information or to download the May 2023 Central Texas Housing Market Report, visit ABoR.com/MarketStatistics.