
AUSTIN, Texas — According to the Austin Board of REALTORS® July 2023 Central Texas Housing Market Report, closed listings increased 0.6% year-over-year to 2,815 closed sales across the Austin-Round Rock MSA. When considering July 2022 is when the market initially began to stabilize, and when combined with pending sales rising 14.5% to 2,892 pending sales, the housing market is poised for a strong finish to 2023.

In July across the Austin-Round Rock MSA, sales dollar volume dropped 7.2% to $1,668,708,916, while homes spent an average of 59 days on the market, up 37 days from July 2022.
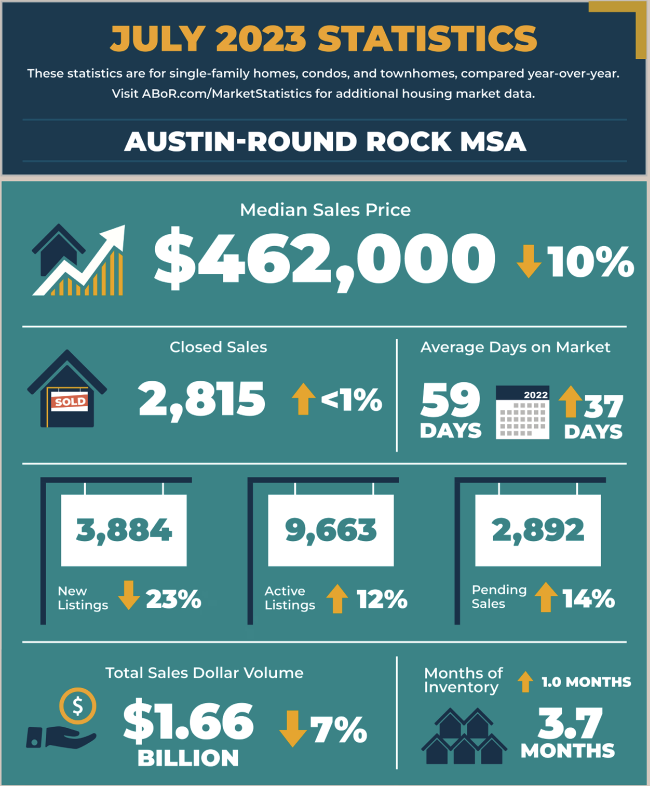
The median price also dropped 10.3% to $462,000 and new listings fell 23.7% to 3,884 listings. Active listings increased 12.8% to 9,663 active listings while housing inventory increased 1.0 months to 3.7 months of inventory.
City of Austin
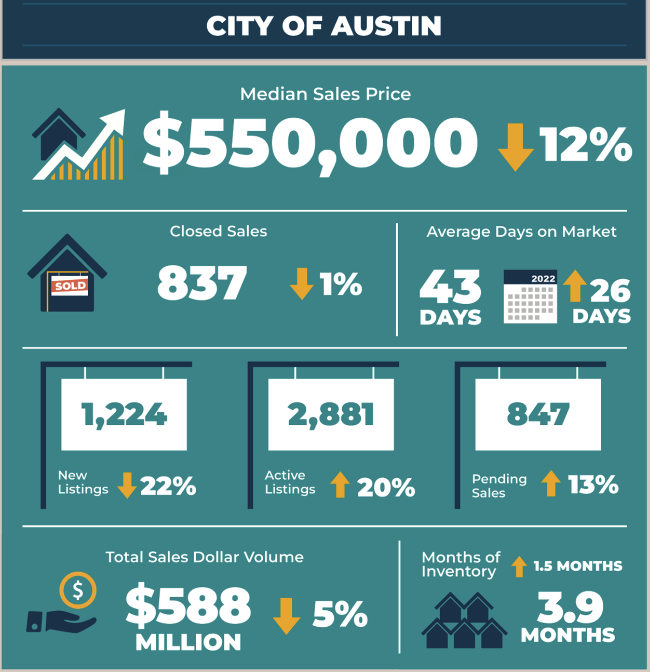
- 837 – Residential homes sold, 1.3% more than July 2022.
- $550,000 – Median price for residential homes, 12.0% less than July 2022.
- 1,224 – New home listings on the market, 22.6% less than July 2022.
- 2,881 – Active home listings on the market, 20.0% more than July 2022.
- 847 – Pending sales, 13.2% more than July 2022.
- 3.9 – Months of inventory, 1.5 months more than July 2022.
- $588,966,529 – Total dollar volume of homes sold, 5.4% less than July 2022.
Travis County
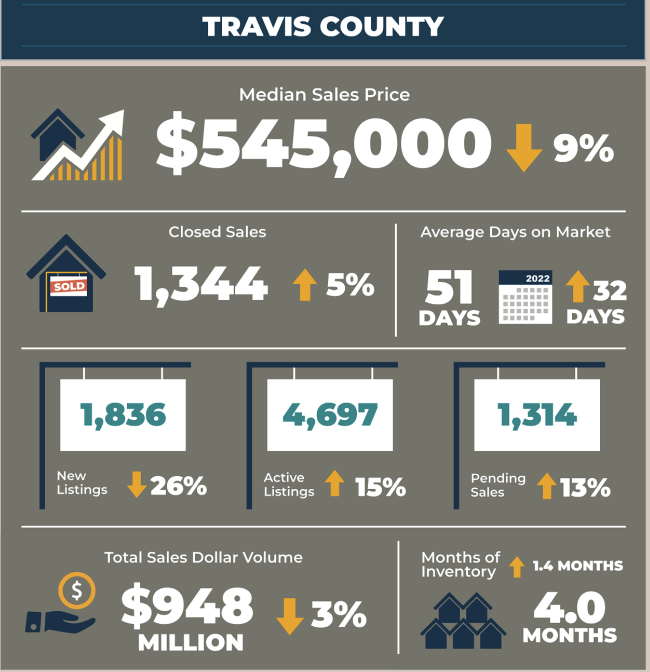
- 1,344 – Residential homes sold, 5.5% more than July 2022.
- $545,000 – Median price for residential homes, 9.2% less than July 2022.
- 1,836 – New home listings on the market, 26.7% less than July 2022.
- 4,697 – Active home listings on the market, 15.8% more than July 2022.
- 1,314 – Pending sales, 13.7% more than July 2022.
- 4.0 – Months of inventory, 1.4 months more than July 2022.
- $948,942,496 – Total dollar volume of homes sold, 3.0% less than July 2022.
Williamson County
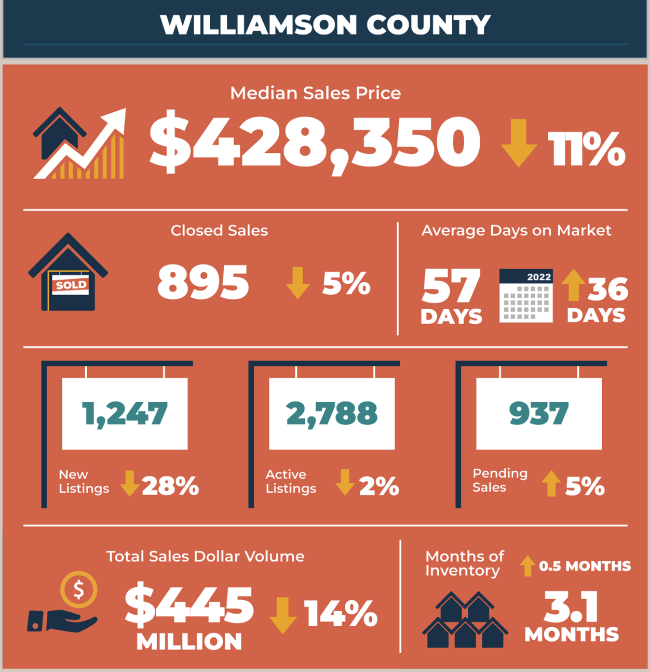
- 895 – Residential homes sold, 5.4% less than July 2022.
- $428,350 – Median price for residential homes, 11.7% less than July 2022.
- 1,247 – New home listings on the market, 28.1% less than July 2022.
- 2,788 – Active home listings on the market, 2.1% less than July 2022.
- 937 – Pending sales, 5.6% more than July 2022.
- 3.1 – Months of inventory, 0.5 months more than July 2022.
- $445,147,628 – Total dollar volume of homes sold, 14.5% less than July 2022.
Hays County
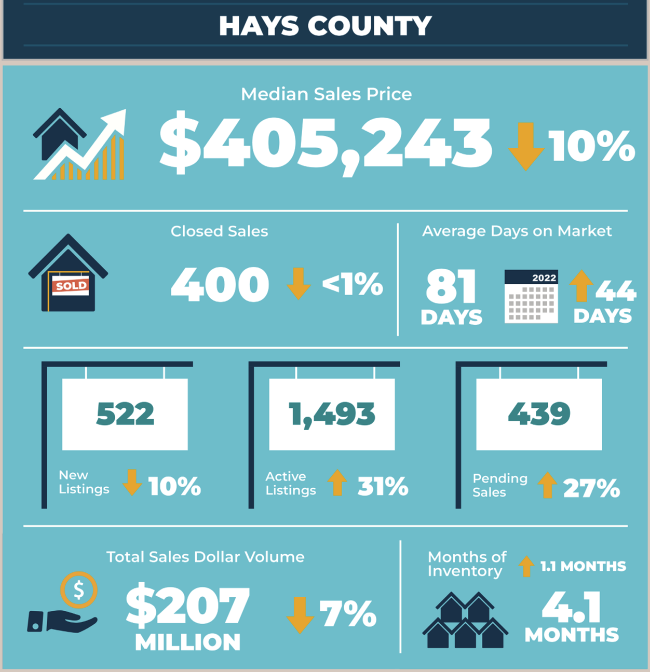
- 400 – Residential homes sold, 0.3% less than July 2022.
- $405,243 – Median price for residential homes, 10.5% less than July 2022.
- 522 – New home listings on the market, 10.8% less than July 2022.
- 1,493 – Active home listings on the market, 31.1% more than July 2022.
- 439 – Pending sales, 27.3% more than July 2022.
- 4.1 – Months of inventory, 1.1 months more than July 2022.
- $207,159,668 – Total dollar volume of homes sold, 7.1% less than July 2022.
Bastrop County
- 132 – Residential homes sold, 9.1% more than July 2022.
- $349,995 – Median price for residential homes, 15.7% less than July 2022.
- 210 – New home listings on the market, 1.9% less than July 2022.
- 545 – Active home listings on the market, 25.6% more than July 2022.
- 143 – Pending sales, 40.2% more than July 2022.
- 4.6 – Months of inventory, 1.2 months more than July 2022 and the highest inventory in the MSA.
- $53,217,578 – Total dollar volume of homes sold, 0.9% less than July 2022.
Caldwell County
- 44 – Residential homes sold, 22.8% less than July 2022.
- $298,048 – Median price for residential homes, 20.2% less than July 2022.
- 69 – New home listings on the market, 38.0% more than July 2022.
- 140 – Active home listings on the market, 55.6% more than July 2022.
- 59 – Pending sales, 68.6% more than July 2022.
- 3.4 – Months of inventory, 1.1 months more than July 2022.
- $13,797,745 – Total dollar volume of homes sold, 41.0% less than July 2022.