
AUSTIN, TX — In the Austin-Round Rock MSA, closed sales rose by 1.4% to 2,939 sales, the first increase in closed sales year-over-year since February 2022, according to Austin Board of REALTORS® August 2023 Central Texas Housing Market Report. Through the Austin-Round Rock MSA, the region also experienced an 8.8% month-over-month increase in closed sales, a healthy indication of buyer confidence in the market. Housing inventory also continues to show gradual progress with a year-over-year increase of 1.0 month to 3.8 months of inventory.

In August, sales dollar volume fell 6.0% to $1,713,589,878, while homes spent an average of 60 days on the market, up 28 days from August 2022 across the Austin-Round Rock MSA.
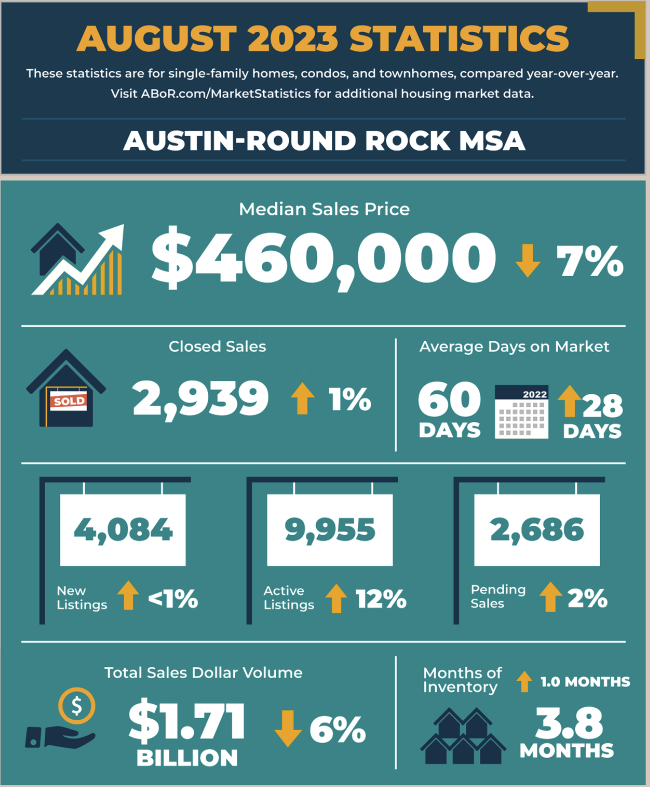
The median price slightly dropped 7.6% to $460,000 while new listings ticked up 0.3% to 4,084 listings, active listings jumped 12.2% to 9,955 listings and pending listings rose slightly 2.0% to 2,686 listings.
City of Austin
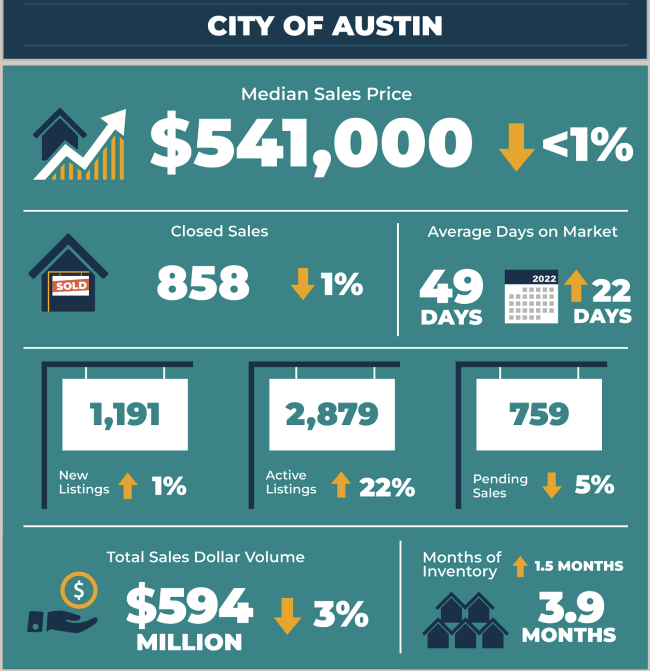
- 858 – Residential homes sold, 1.3% less than August 2022.
- $541,000 – Median price for residential homes, 0.7% less than August 2022.
- 1,191 – New home listings on the market, 1.9% more than August 2022.
- 2,879 – Active home listings on the market, 22.8% more than August 2022.
- 759 – Pending sales, 5.8% less than August 2022.
- 3.9 – Months of inventory, 1.5 months more than August 2022.
- $594,479,723 – Total dollar volume of homes sold, 3.4% less than August 2022.
Travis County
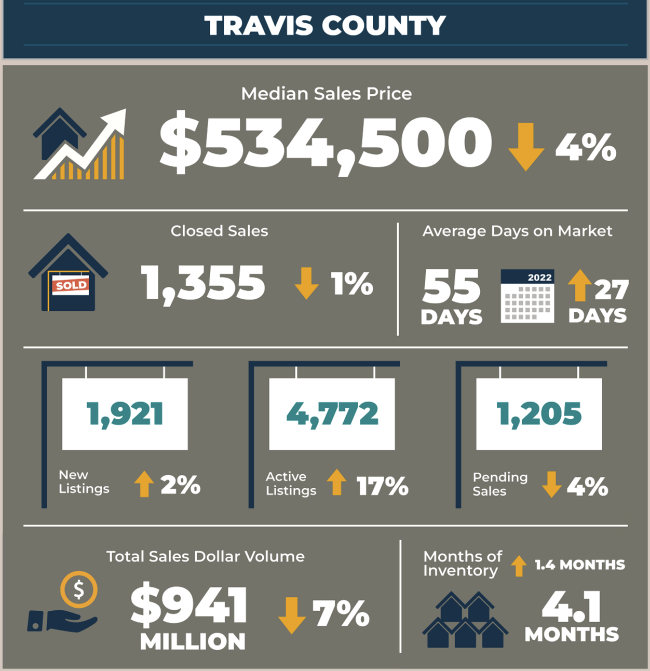
- 1,355 – Residential homes sold, 1.6% less than August 2022.
- $534,500 – Median price for residential homes, 4.8% less than August 2022.
- 1,921 – New home listings on the market, 2.4% more than August 2022.
- 4,772 – Active home listings on the market, 17.7% more than August 2022.
- 1,205 – Pending sales, 4.1% less than August 2022.
- 4.1 – Months of inventory, 1.4 months more than August 2022.
- $941,065,528 – Total dollar volume of homes sold, 7.5% less than August 2022.
Williamson County
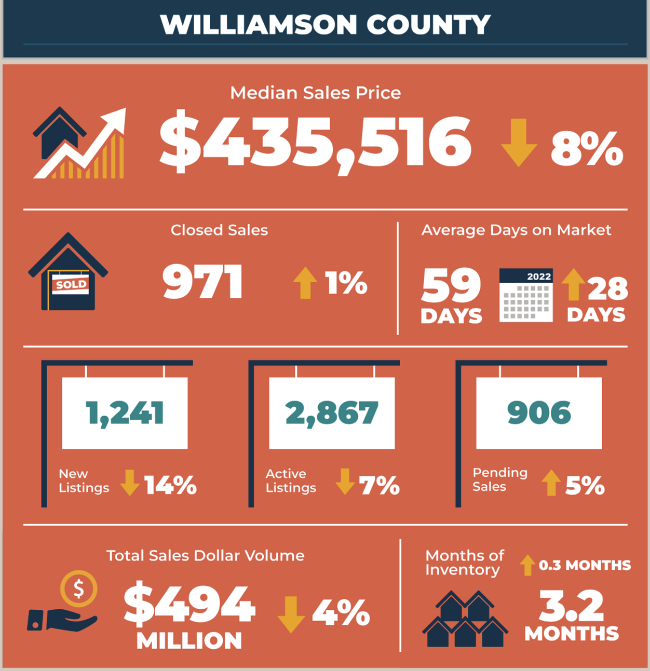
- 971 – Residential homes sold, 1.7% more than August 2022.
- $435,516 – Median price for residential homes, 8.7% less than August 2022.
- 1,241 – New home listings on the market, 14.7% less than August 2022.
- 2,867 – Active home listings on the market, 7.9% less than August 2022.
- 906 – Pending sales, 5.7% more than August 2022.
- 3.2 – Months of inventory, 0.3 months more than August 2022.
- $494,684,214 – Total dollar volume of homes sold, 4.6% less than August 2022.
Hays County
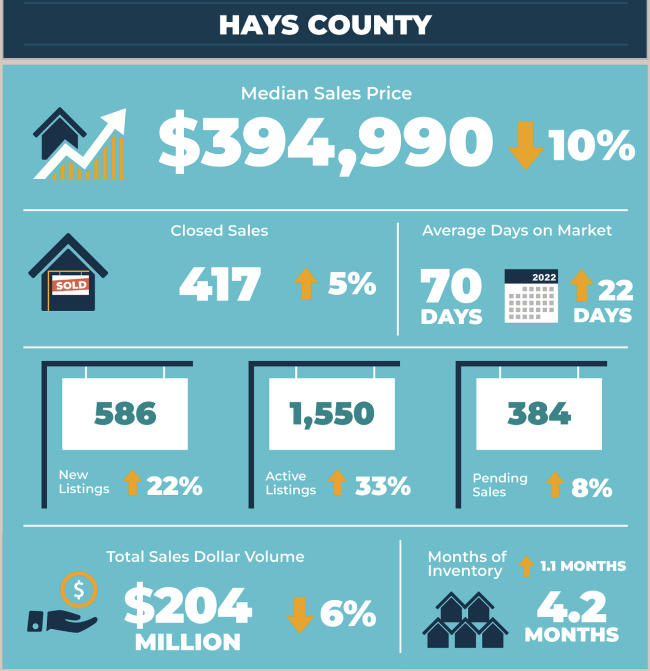
- 417 – Residential homes sold, 5.3% more than August 2022.
- $394,990 – Median price for residential homes, 10.1% less than August 2022.
- 586 – New home listings on the market, 22.3% more than August 2022.
- 1,550 – Active home listings on the market, 33.9% more than August 2022.
- 384 – Pending sales, 8.2% more than August 2022.
- 4.2 – Months of inventory, 1.1 months more than August 2022.
- $204,932,717 – Total dollar volume of homes sold, 6.0% less than August 2022.
Bastrop County
- 154 – Residential homes sold, 29.4% more than August 2022.
- $339,990 – Median price for residential homes, 15.0% less than August 2022.
- 244 – New home listings on the market, 18.5% more than August 2022.
- 586 – Active home listings on the market, 28.0% more than August 2022.
- 146 – Pending sales, 19.7% more than August 2022.
- 4.8 – Months of inventory, 1.2 months more than August 2022 and the highest inventory in the MSA.
- $58,611,157 – Total dollar volume of homes sold, 15.4% more than August 2022.
Caldwell County
- 42 – Residential homes sold, 17.7% less than August 2022.
- $299,990 – Median price for residential homes, 6.9% less than August 2022.
- 92 – New home listings on the market, 61.4% more than August 2022.
- 180 – Active home listings on the market, 95.7% more than August 2022.
- 45 – Pending sales, 4.7% more than August 2022.
- 4.4 – Months of inventory, 2.2 months more than August 2022.
- $13,170,575 – Total dollar volume of homes sold, 31.2% less than August 2022.
For more information or to download the August 2023 Central Texas Housing Market Report, visit ABoR.com/MarketStatistics.