
AUSTIN, Texas — In the Austin-Round Rock MSA, housing inventory reached 4.0 months of inventory, the highest level in more than eight years, according to the Austin Board of REALTORS® September 2023 Central Texas Housing Market Report.

The market also experienced a drop in closed sales, which decreased by 18.2% year over year to 2,387 sales, and the median close price dipped 4.3% year over year to $452,080, both symptomatic of higher mortgage rates and highlighting the need for sellers to connect with and rely on REALTORSⓇ.
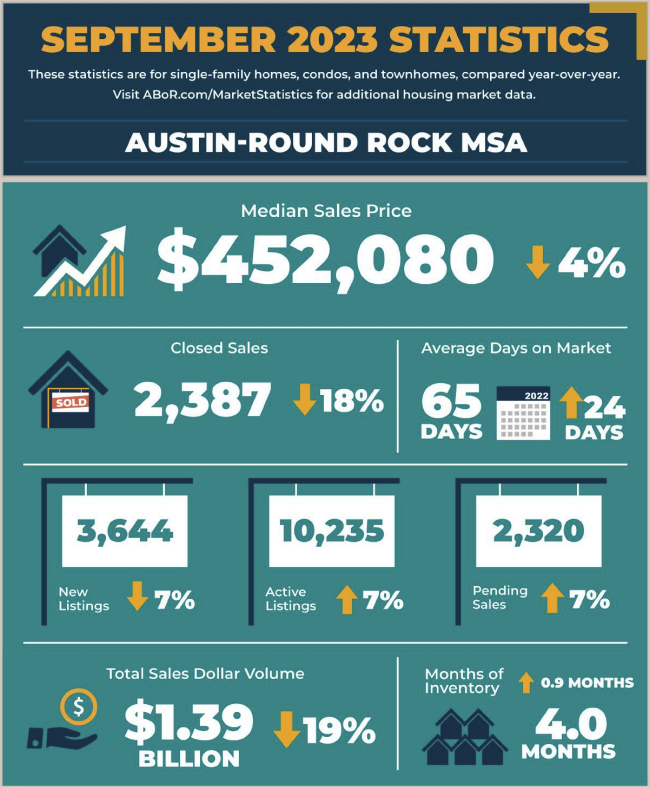
In September, sales dollar volume fell 19.8% year over year to $1,390,205,344, while homes spent an average of 65 days on the market, up 24 days from September 2022 across the Austin-Round Rock MSA. New listings decreased 7.0% year over year to 3,644 listings, active listings jumped 7.8% year over year to 10,235 listings and pending listings rose 7.7% year over year to 2,320 listings. There were 2,387 residential homes sold across the MSA, a 18.2% decrease from September 2022.
City of Austin
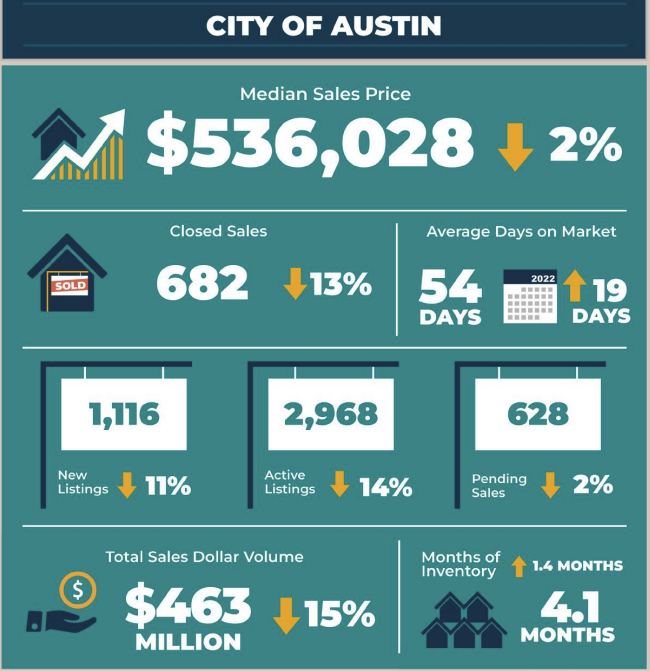
- 682 – Residential homes sold, 13.3% less than September 2022.
- $536,028 – Median price for residential homes, 2.5% less than September 2022.
- 1,116 – New home listings on the market, 11.2% less than September 2022.
- 2,968 – Active home listings on the market, 14.2% more than September 2022.
- 628 – Pending sales, 2.6% more than September 2022.
- 4.1 – Months of inventory, 1.4 months more than September 2022.
- $463,473,176 – Total dollar volume of homes sold, 15.4% less than September 2022.
Travis County
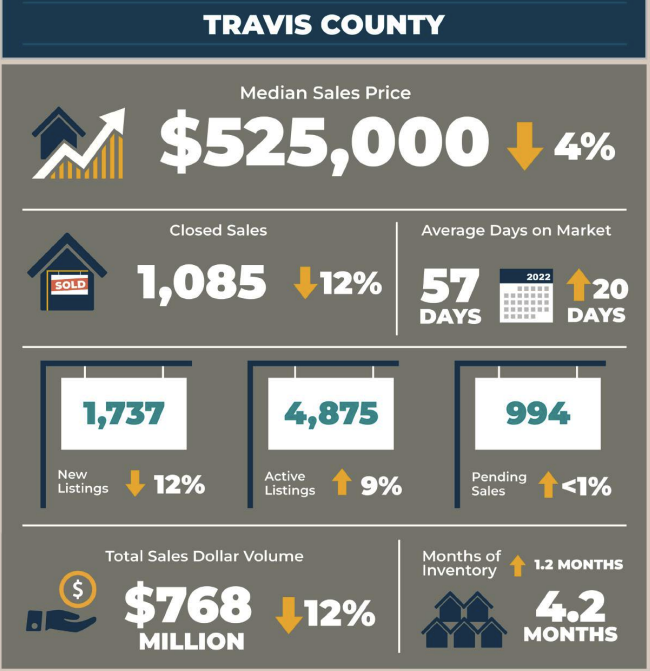
- 1,085 – Residential homes sold, 12.7% less than September 2022.
- $525,000 – Median price for residential homes, 4.2% less than September 2022.
- 1,737 – New home listings on the market, 12.9% less than September 2022.
- 4,875 – Active home listings on the market, 9.4% more than September 2022.
- 994 – Pending sales, 0.5% more than September 2022.
- 4.2 – Months of inventory, 1.2 months more than September 2022.
- $768,624,857 – Total dollar volume of homes sold, 12.0% less than September 2022.
Williamson County
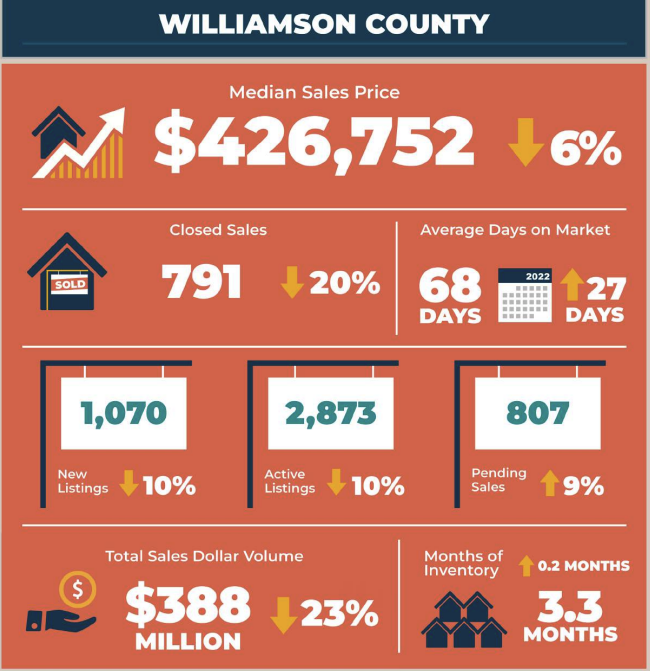
- 791 – Residential homes sold, 20.4% less than September 2022.
- $426,752 – Median price for residential homes, 6.1% less than September 2022.
- 1,070 – New home listings on the market, 10.5% less than September 2022.
- 2,873 – Active home listings on the market, 10.6% less than September 2022.
- 807 – Pending sales, 9.7% more than September 2022.
- 3.3 – Months of inventory, 0.2 months more than September 2022.
- $388,535,209 – Total dollar volume of homes sold, 23.4% less than September 2022.
Hays County
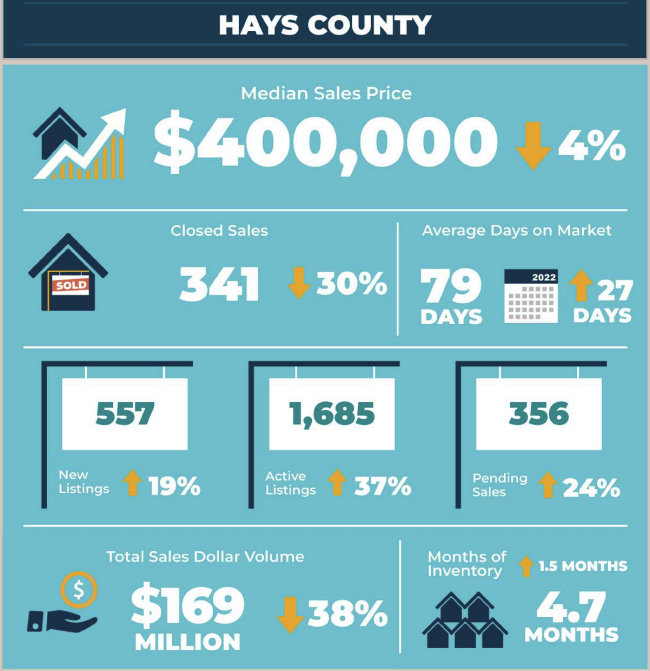
- 341– Residential homes sold, 30.3% less than September 2022.
- $400,000 – Median price for residential homes, 4.3% less than September 2022.
- 557 – New home listings on the market, 19.0% more than September 2022.
- 1,685 – Active home listings on the market, 37.9% more than September 2022.
- 356 – Pending sales, 24.5% more than September 2022.
- 4.7 – Months of inventory, 1.5 months more than September 2022.
- $169,681,296 – Total dollar volume of homes sold, 38.1% less than September 2022.
Bastrop County
- 133 – Residential homes sold, 11.9% less than September 2022.
- $340,000 – Median price for residential homes, 10.7% less than September 2022.
- 199 – New home listings on the market, 6.1% less than September 2022.
- 610 – Active home listings on the market, 23.5% more than September 2022.
- 112 – Pending sales, 5.9% less than September 2022.
- 5.0 – Months of inventory, 1.2 months more than September 2022 and the highest inventory in the MSA.
- $50,253,715 – Total dollar volume of homes sold, 22.9% less than September 2022.
Caldwell County
- 37– Residential homes sold, 9.8% less than September 2022.
- $289,330 – Median price for residential homes, 13.9% less than September 2022.
- 81 – New home listings on the market, 68.8% more than September 2022.
- 192 – Active home listings on the market, 77.8% more than September 2022.
- 51 – Pending sales, 112.5% more than September 2022.
- 4.7 – Months of inventory, 2.1 months more than September 2022.
- $11,872,930 – Total dollar volume of homes sold, 11.0% less than September 2022.
For more information or to download the September 2023 Central Texas Housing Market Report, visit ABoR.com/MarketStatistics.