
AUSTIN, Texas — The Austin-Round Rock MSA housing market continued its normalizing trend for the third consecutive month, boosted by a more sustainable rate of price growth and more available supply, according to The Austin Board of REALTORS® August 2022 Central Texas Housing Market Report.

Active listings in the five-county area skyrocketed 170.2%, causing housing inventory to reach 2.9 months – the highest inventory level since September 2018. Additionally, year-over-year home price growth was less than 6% for the first time since June 2020. The median home price increased by 5.5% annually to $496,039, setting a price record for the month of August while also indicating a normalization of home price appreciation that economists say is consistent with historical norms.
In August, residential home sales declined 23% year over year to 2,924 closed sales. Sales dollar volume declined 14.7.% to $1,844,350,661, while new listings dipped slightly at 6.2% to 4,121 listings.
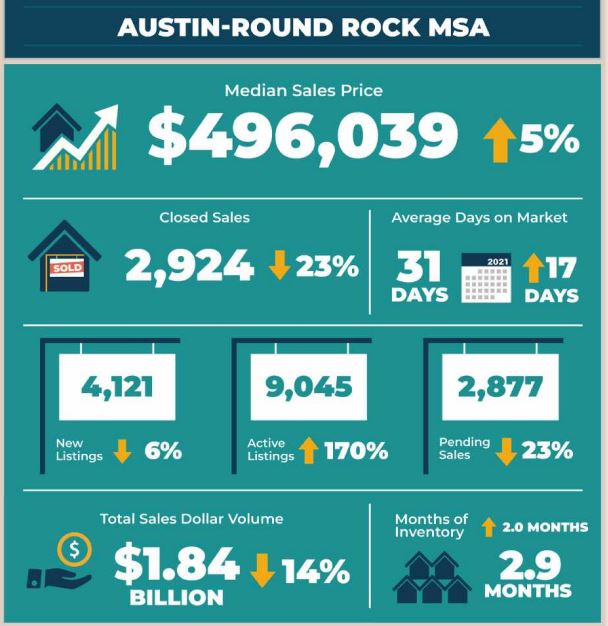
Homes spent an average of 31 days on the market, the first time average days on market has topped one month since February 2018.
City of Austin
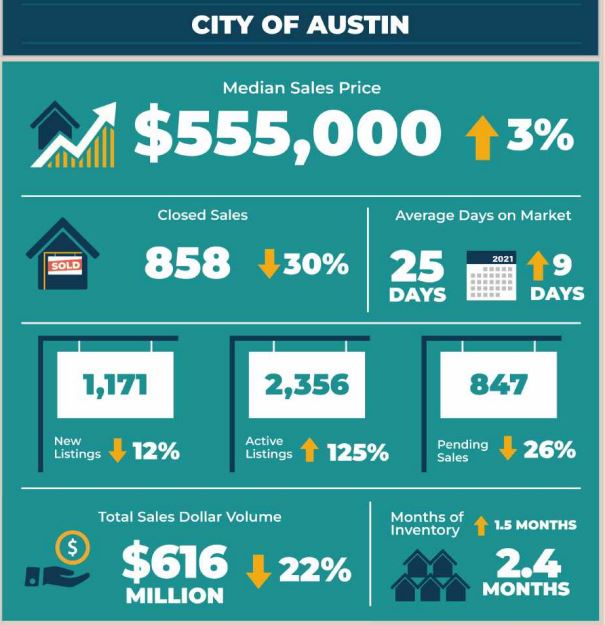
In August, home sales decreased 30.4% to 858 sales, while sales dollar volume decreased 22.6% to $616,474,222. At the same time, median price rose 3.6% setting a record for the month of August of $555,000 for the City of Austin. Last month, new listings slightly dropped 12.7% to 1,171 listings, active listings skyrocketed 125.9% to 2,356 listings as pending sales declined by 26.9% to 847 pending sales. Monthly housing inventory increased 1.5 months year over year to 2.4 months of inventory.
Travis County
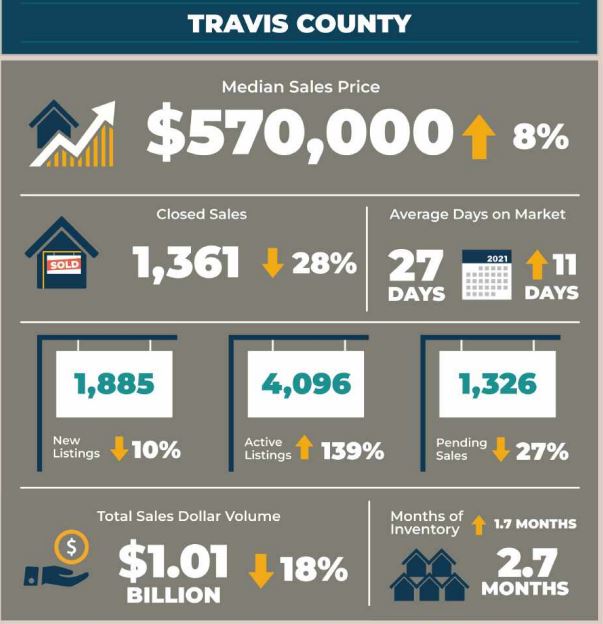
In Travis County, home sales decreased 28.9% to 1,361 sales, while sales dollar volume decreased 18.7% to $1,017,967,018. Last month, median price in Travis County rose 8.6% year over year to $570,000 as new listings decreased 10.9% to 1,885 listings and active listings ballooned 139.8% to 4,096 listings year over year. Pending sales declined 27.3% to 1,326 as monthly housing inventory increased 1.7 months year over year to 2.7 months of inventory.
Williamson County
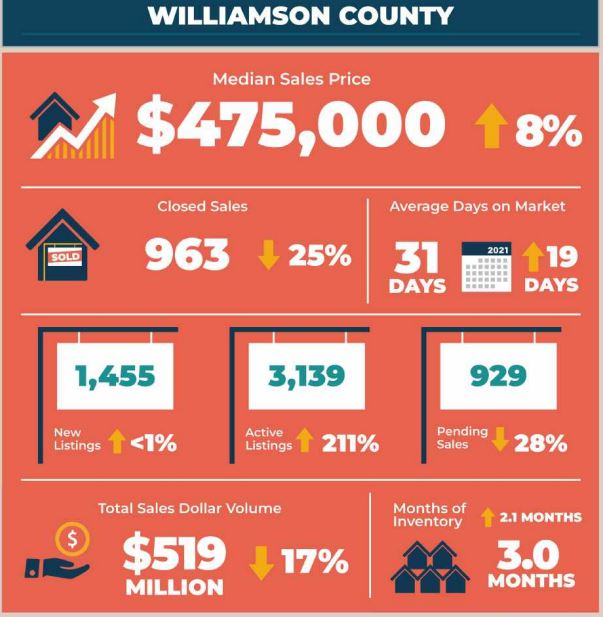
August home sales decreased 25.2% to 963 sales in Williamson County. Sales dollar volume declined 17.7% year over year to $519,535,063. The median price increased 8% to $475,000 as new listings ticked up 0.9% to 1,455 listings. During the same period, active listings soared 211.4% to 3,139 listings while pending sales dropped 28.2% to 929 pending sales. Housing inventory rose 2.1 months to 3.0 months of inventory.
Hays County
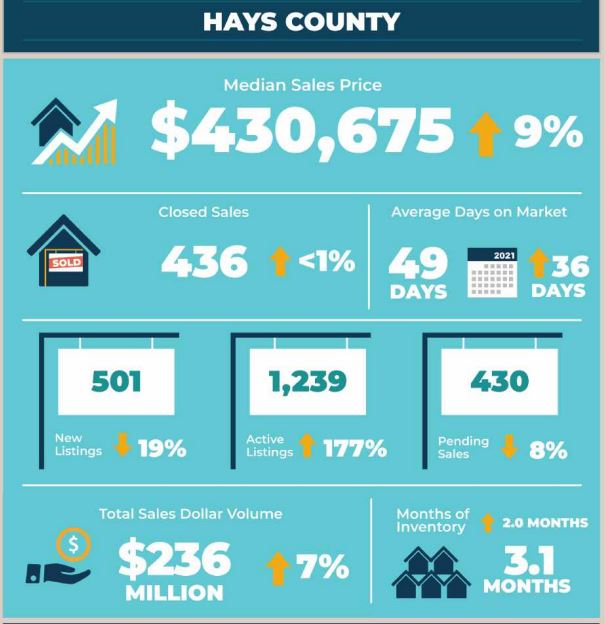
In Hays County, August home sales ticked up 0.2% to 436 sales, while sales dollar volume slightly also increased 7.0% to $236,053,526. The median price for homes increased 9.9% to $430,675. During the same period, new listings declined 19.1% to 501 listings, while active listings skyrocketed by 177.2% to 1,239 listings. Pending sales decreased 8.3% to 430 pending sales as housing inventory jumped by 2 months to 3.1 months of inventory.
Bastrop County
Last month, Bastrop County home sales decreased 15.1% year over year to 118 sales, while sales dollar volume fell by 2.6% to $50,428,898. Median price increased 20.1% to $400,000 as new listings rose 28.3% to 213 listings. Active listings soared 231.9% to 468 listings as pending sales also increased 16.1% to 144 pending sales. Housing inventory increased 2.6 months to 3.7 months of inventory, the highest level of inventory across the MSA in August.
Caldwell County
In Caldwell County in August, home sales increased 91.7% to 46 home sales, and sales dollar volume rose 147.2% to $18,043,319. The median home price rose 10.2% year over year to $331,044. At the same time, new listings increased by 34.0% to 67 listings as active listings increased 139.5% to 103 listings. Pending sales dropped 2.0% to 48 pending sales, and housing inventory increased 1.1 months to 2.5 months of inventory.
For more information or to download the August 2022 Central Texas Housing Market Report, visit ABoR.com/MarketStatistics.