
AUSTIN, TX — According to the Austin Board of REALTORS® (ABoR) November Central Texas Housing Report, closed listings dipped 4.9% to 3,215 across the Austin-Round Rock MSA in November. This occurred even as the housing market remains on track for a record-breaking year, with closed listings outpacing 2020 by 3.1% last month.

In November, 53% of the 3,215 closed listings —1,694 homes —sold between $250,000 and $500,000, today’s typical price range for first-time and first-time move-up homebuyers. This data indicates that despite a fast-paced market and record-low inventory, opportunity still exists to find the right home
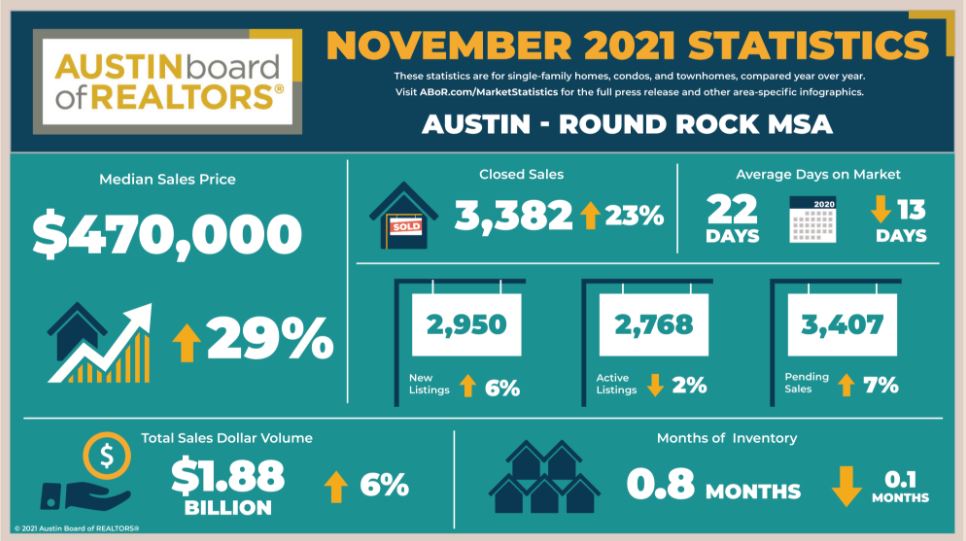
In November, median sales price rose 29.7% to $470,000 — a record for the month of November — and sales dollar volume rose 20.5% to $1,882,296,166. New listings increased 6.7% to 2,950 as active listings ticked down 2.2% to 2,768. Concurrently, pending listings rose 7.6% to 3,407 as inventory dropped 0.1 months to 0.8 months of inventory. Homes spent an average of 22 days on the market, down 13 days from November 2020.
City of Austin
In the city of Austin, the median home price rose 24.2% year over year to $540,000––a record for the month of November. Home sales decreased 4.3% to 1,053 sales, while sales dollar increased 17.6% to $705,190,726. During the same period, new listings decreased 1.9% to 880 listings, active listings dropped 22.2% to 822 listings, while pending sales increased 3.6% to 1,049 pending sales. Monthly housing inventory decreased 0.3 months year over year to 0.7 months of inventory.
Travis County
At the county level, home sales also decreased 5.5% to 1,622 sales, while sales dollar volume increased 16.4% to $1,112,101,674. The median price for a home also increased 24.6% year over year to $529,500. During the same period, new listings decreased 2.7% to 1,356 listings, while active listings declined by 13.6% to 1,311 listings. Pending sales increased 5% to 1,672 pending sales as monthly housing inventory decreased 0.1 months year over year to 0.8 months of inventory.
Williamson County
In Williamson County, November homes sales decreased 1.3% to 1,105 sales, while sales dollar volume rose 37.2% to $549,681,505. The median price rose 36.5% to $445,000, and new listings increased 12% to 1,011 listings. During the same period, active listings rose 24.7% to 753 listings, and pending sales also increased 13% to 1,151 pending sales. Housing inventory increased 0.2 months to 0.7 months of inventory.
Hays County
In Hays County, November home sales decreased 16.3% to 329 sales, while sales dollar volume dropped 3.8% to $159,743,802. The median price for homes rose 27.9% to $390,000. During the same period, new listings increased 24.4% to 418 listings, while active listings also rose 7.6% to 466 listings. At the same time, pending sales increased 2.2% to 417 pending sales. Housing inventory stayed level at 1.1 months of inventory.
Bastrop County
In November, Bastrop County home sales increased 3.4% to 122 sales, and sales dollar volume rose 44.4% to $47,225,012. The median price also increased 32.2% to $345,000. During the same period, new listings increased 6.5% to 115 listings, while active listings decreased 11.7% to 182 listings. Pending sales increased 6.9% to 124 pending sales and housing inventory decreased 0.5 months to 1.4 months of inventory.
Caldwell County
In Caldwell County, November home sales increased 5.7% to 37 home sales, and sales dollar volume increased 58.9% to $12,023,519. The median home price increased 29.3% year over year to $265,109. At the same time, new listings increased 117.4% to 50 listings, while active listings decreased 17.7% to 56 listings. Pending sales increased 38.7% to 43 pending sales, and housing inventory decreased 0.6 months to 1.8 months of inventory.
For more information or to download the November 2021 Central Texas Housing Market Report, visit ABoR.com/MarketStatistics.