The Travis County housing data shows September 2025 has lower median price than the same month one and two years ago, but more transactions than 2024 (and roughly in line with 2023), with substantially greater inventory (active listings and months of inventory), a classic sign of a more buyer-friendly market compared with the very tight market conditions of 2022–early 2023.

1) Median sale price — trend and interpretation
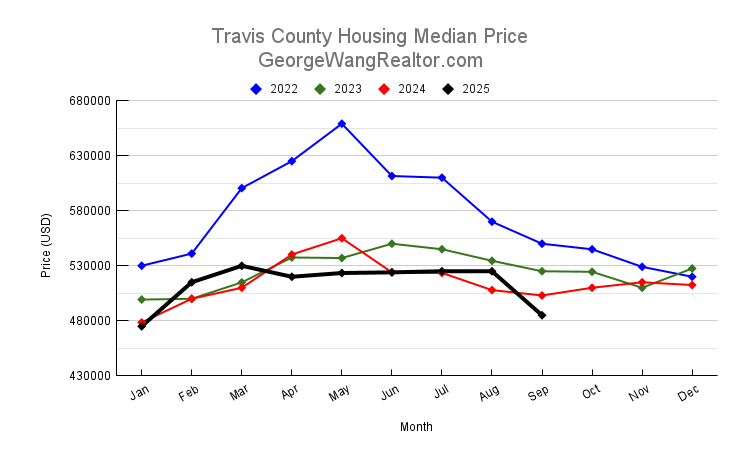
- Peak and decline: The median sale price in this dataset peaked around mid–2022 (e.g., May 2022 median $659,000), then declined through 2023 and bottomed/softened in 2024.
-
Recent movement: For the year-level picture, median medians were:
- 2022 median (series median): $560,000
- 2023 median: $526,250
- 2024 median: $511,250
- 2025 year-to-date median: $523,400
So after a multi-year drop from 2022 highs, 2025 shows a partial stabilization / modest rebound relative to 2024 (2025 YTD median ≈ +2.4% vs 2024 median), but remains below the 2022 peak and very slightly below 2023’s mid-levels. In particular, September 2025’s $485,000 is materially lower than the Septembers of 2024 ($503,000) and 2023 ($525,000).
Interpretation: The big price compression occurred after the 2022 peak, likely from higher mortgage rates and more supply. Through 2024 prices settled lower, and 2025 shows some pockets of recovery earlier in the year (spring/summer price strengthening) but by September 2025 prices slipped again relative to last year’s September. The broader story: prices are no longer in the rapid appreciation mode of 2021–2022 — instead we’re in a market that is closer to balance or slightly buyer-favored with local/monthly variability.
2) Months of inventory — trend and implications
-
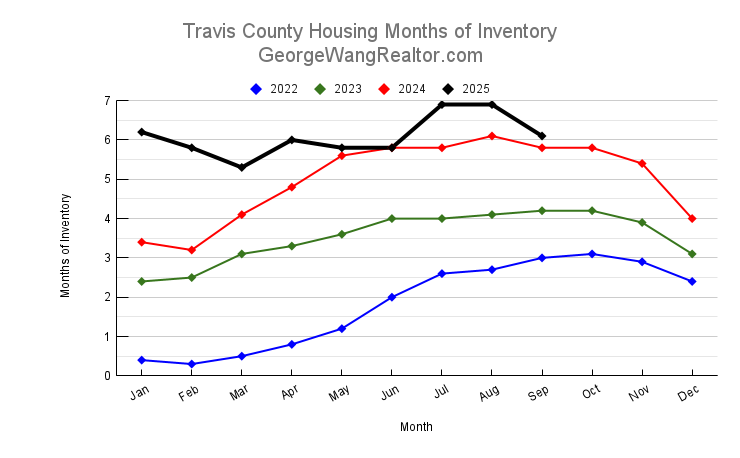
Clear and large increase: Average months-of-inventory by year increased markedly:
- 2022 average: ~1.8 months (very tight, seller’s market)
- 2023 average: ~3.53 months (loosening)
- 2024 average: ~4.98 months (moving toward balance)
- 2025 year-to-date average: ~6.09 months (materially higher)
- September specifics: Months of inventory rose from 4.2 in Sept 2023 → 5.8 in Sept 2024 → 6.1 in Sept 2025 (a +45% change versus 2023).
Implication: Months of inventory above ~6 months is traditionally associated with a balanced-to-buyer market. The steady increase from sub-2 months in 2022 to ~6 months in 2025 signals a structural loosening of the market — more choices for buyers, less upward pressure on prices, and more time for buyers to negotiate.
3) Closed sales — trend
-
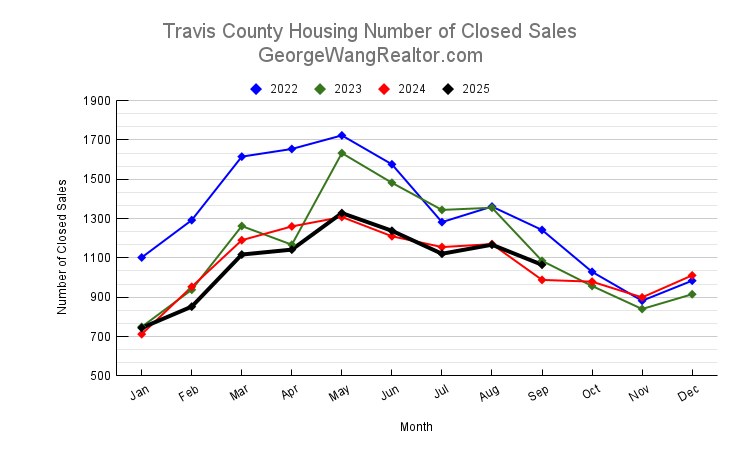
Annual closed-sales totals (sum by year):
- 2022: 15,742 closed sales
- 2023: 13,727 (down ≈12.8% vs 2022)
- 2024: 12,835 (down further)
- 2025 YTD (through Sept): 9,774 (note: this is year-to-date partial data in your table—if you treat it like an annualized pace it still trails earlier years)
- Monthly behavior: After very strong closed sales in many months of 2022, closings declined in 2023–2024, with 2025 showing some recovery in certain months (for example May 2025 had 1,328 closed sales, one of the stronger months in recent years). September 2025 (1,065 closings) is up vs Sept 2024 (988) but slightly down vs Sept 2023 (1,085).
Interpretation: The long-run decline from 2022 highs is consistent with market cooling; however, the bounce in some 2025 months suggests active buyers remain — many buyers may be waiting for right-priced listings, or responding to seasonal opportunities and rate movements.
4) New listings — trend
-
Year-level totals and behavior:
- New listings surged off 2022 levels: 2022 total (sum) ≈ 22,168, 2023 ≈ 20,904, 2024 ≈ 21,739, 2025 YTD ≈ 19,704 (through Sept).
- Monthly peaks: new listings rose in spring 2025 (peak months like April–May 2025 show high new listing counts — e.g., April 2025 = 2,923 new listings; May 2025 = 2,780).
- September trajectory: New listings in September were 1,674 (2025) — essentially flat vs Sept 2024 (1,687) and slightly below Sept 2023 (1,737).
Interpretation: Inventory growth is not solely from a single spike in new listings; rather, it’s a combination of sustained higher availability and more active listings remaining on market (active listings increased substantially). Spring 2025 showed very strong listing activity — but by late summer/fall, new listing flow tapered closer to prior-year levels, while aggregated active inventory remained elevated.
5) Active listings — trend (additional important context)
-
Active listings have climbed dramatically:
- 2022 average active listings: ~2,732
- 2023 average: ~4,191
- 2024 average: ~5,345
- 2025 YTD average: ~6,393
That jump in active listings is a large driver of the rise in months of inventory and explains why buyers have more options even when new-listing flow is not dramatically higher.
What this means for buyers and sellers
- Buyers: Greater inventory and months of inventory (~6 months) mean more negotiating room, fewer multiple-offer wars, and more time to shop. Look for listings priced correctly and be prepared to negotiate concessions and inspection terms. Spring 2025 showed strong listing flow — good opportunity months historically.
- Sellers: The market is no longer the ultra-fast seller’s market of 2021–2022. Price realistically, stage and prepare homes to stand out, and expect slightly longer marketing times and more buyer contingencies.
Conclusion
The Travis County residential market has shifted meaningfully since the run-up in 2022. From very low inventory and high median prices in 2022, the market has moved toward higher supply and more balanced conditions. Median prices have softened from 2022 peaks and show only a modest recovery in 2025, while months of inventory and active listings have risen substantially, giving buyers more choice and negotiating power. Closed sales fell from 2022 highs but have shown pockets of renewed activity in 2025. Overall, the market looks calmer and more balanced than the frenzied seller’s market of 2021–22 — a landscape where accurate pricing, good marketing, and smart negotiation matter more than ever.
If you have any questions or need any assistance in finding your new home or investment property, please contact me and I will be more than happy to work with you. You can read my client testimonials here.
Please also check out our rebate program which is a win-win situation for my buyer.